You are using an out of date browser. It may not display this or other websites correctly.
You should upgrade or use an alternative browser.
You should upgrade or use an alternative browser.
Best Thread Potential setups
- Thread starter trader_dante
- Start date
- Watchers 274
- Status
- Not open for further replies.
rollsafe
Active member
- Messages
- 123
- Likes
- 25
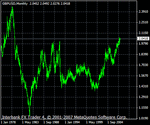
GBP/USD Monthly
A Chart of GBP/USD Monthly
It's a wide potential support zone on the Mthly chart, but cable in it now: see screenshot-

A Chart of GBP/USD Monthly
Attachments
bbmac
Veteren member
- Messages
- 3,584
- Likes
- 789
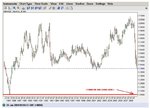
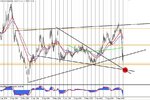
You could be right, Mthly chart has broken 2 ascending support trend lines and all the fib retrace levels bar the 76.4% (1.2983 area) of the move up from that low you pinpoint, 1.0473-2.1162....time will tell.
Gbpusd...1.4060-1.3620 looks like the extent of this previous monthly swing lo zone (=previous support=potential support)
trader_dante
Veteren member
- Messages
- 4,535
- Likes
- 1,704
A Chart of GBP/USD Monthly
I am waiting for my mother or sister to tell me that the Pound is getting hit hard and ask me if it's going to parity.
As soon as they do I am going to buy it with everything I have.
jverho
Junior member
- Messages
- 28
- Likes
- 0
Hi jverho, sorry, I try to be constructive usually but there are a few people on here that tend to attack me when I post and help others - plus a lot of the time, the questions I see people ask are ones I've already answered many times. Nothing irritates me more than someone that says "can you just tell me X....sorry if you've answered this before but I can't be bothered to read through your threads as they are really long..."That's not aimed at you at all because you were just posting a chart...I'm just saying that sometimes it all gets a bit much and I decide its less hassle to just post smart ass comments and the wrong person gets the brunt of it, so apologies mate!
Hi Dante, no worries, my comment wast about you...🙂 I welcome constructive critique :clap:, and as long as it has some merit it is usually helpfull and takes things forward. I am here, bacause I am looking for of 'donkey free' forex forum where good traders exhage quality trading ideas 👍 I hope this is one of them😀
The Philosopher
Junior member
- Messages
- 28
- Likes
- 12
jverho
Junior member
- Messages
- 28
- Likes
- 0
Sell AUDUSD on potential for further risk aversion
Mkt: 0.6577 - Target : 0.6250 - Stop:0.6525
"
Arguments
1 AUDUSD bounced late late week and overnight as equity markets managed a dead-cat bounce ahead of president Obama's inauguration, but we suspect that the inauguration could be a buy the rumor, sell the fact phenomenon in terms of risk appetite - with a return to risk aversion favoring AUD weaker and the USD stronger.
2 The fundamentals in the Australian economy are unwinding rapidly and we are concerned about Australian exposure to the rapidly decelerating Asian export economies that Australia's commodity-based economy feeds. As well, domestic demand should continue to contract sharply as the credit bubble unwinds this year.
3 Technical: the recent bounce after the strong downdraft of late provides a reasonable entry level for testing a resumption of the downside after the Asian session's highs didn't hold overnight. "
(Source: SAXO Bank)
Chart AUD/USD
Attachments
rollsafe
Active member
- Messages
- 123
- Likes
- 25
15 tick stop is all you need.
Its here NOW
Attachments
glyder
Established member
- Messages
- 755
- Likes
- 94
I am waiting for my mother or sister to tell me that the Pound is getting hit hard and ask me if it's going to parity.
As soon as they do I am going to buy it with everything I have.
They may be asking you very soon with articles like this (from the telegraph) in the papers...
Whoops! Browser Settings Incompatible
I can't find a chart with enough history to see the 2 decade support line he refers to.
Last edited:
Anyone care to join me for a spot of twig bird shooting? theres a certain half british/half japanese variety with my name on it! 😀
Lesson learned ( written in the style of socrates/ presented in the style of ccclarete):idea:
"Be like a bird on the twig. Once the bird comes to know that the twig is going to break it flies off. If the bird holds on to the twig tightly, it will fall badly when the twig breaks. Similarly, if we get too attached to the things of this world, we will feel a lot of pain when these worldly transient things leave us, which they will do one day."
"A bird, perched on a small branch, knows that the branch may break at any moment; so it is very alert and wide awake, always ready to fly. It knows that if there is a hurricane or a strong breeze, the branch could suddenly break."
:idea:😛😆:idea:
Last edited:
I am waiting for my mother or sister to tell me that the Pound is getting hit hard and ask me if it's going to parity.
As soon as they do I am going to buy it with everything I have.
It should nearly be there give it a week or two.
You may ask why, well I just dumped all my sterling based assets to $ as we broke 1.45 thats why.
rollsafe
Active member
- Messages
- 123
- Likes
- 25
They may be asking you very soon with articles like this (from the telegraph) in the papers...
Whoops! Browser Settings Incompatible
I can't find a chart with enough history to see the 2 decade support line he refers to.
Go here: Live forex charts, real-time forex charts, live currency charts first select GBP/USD then change Time Scale to MONTHLY
rollsafe
Active member
- Messages
- 123
- Likes
- 25
glyder
Established member
- Messages
- 755
- Likes
- 94
Go here: Live forex charts, real-time forex charts, live currency charts first select GBP/USD then change Time Scale to MONTHLY
rolsafe, many thanks for that and the link (wish I could get mine to read correctly rather than'whoops etc').
looks like the £ is right near that crucial long term level right now, make or break bounce (or drop) time is nearby.
trader_dante
Veteren member
- Messages
- 4,535
- Likes
- 1,704
I think there is going to be the dickens to pay in stocks today.
No way is this support at 7878 on the Dow going to last for long. Personally I would sell any rallies because when that goes, we're off to the lows for a double bottom...or armageddon! 😉
Long bonds all the way...
You have to take advantage of times like this as it's basically free money!
No way is this support at 7878 on the Dow going to last for long. Personally I would sell any rallies because when that goes, we're off to the lows for a double bottom...or armageddon! 😉
Long bonds all the way...
You have to take advantage of times like this as it's basically free money!
Last edited:
trader_dante
Veteren member
- Messages
- 4,535
- Likes
- 1,704
P.S. I don't mean that above statement in a cocky or arrogant way and it's not a joke. I mean, obviously timing is key in all markets BUT you have to know what's hot because that's where the money is going to be made. Right now CABLE is hot. Indices are HOT. This is where the big moves are going to occur and the volatility means money if you call it right.... 🙂
- Status
- Not open for further replies.
Similar threads
- Replies
- 2
- Views
- 8K


