Best Thread Potential setups

Status
Not open for further replies.
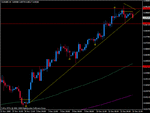
Anybody watching EurCad. Its reached a level last seen in Feb 2004 and a pin has formed on the hourly, although not the best Pin on my charts.

There's not much else to go by and I would be cautious going counter trend off the hourly but its an interesting level and may be worth keeping an eye on.
 
USDJPY Daily Pin

HI,

I was looking at the USDJPY pin last night and made a play on my demo account. Before I go on I want to say that I am new to all this and so I am only learning. I expect to make mistakes hence why I am only on a demo account and would really appreciate any comments on my thought process.

Anyway, it looked like a strong pin to me, with the long nose, short body within the range of the left eye, was at a swing low in a down trend. However, unfortunately there was no confluence as the pin bounced off a 13 year low. I would have rather had a pivot line or a fib but thought the pin looked strong otherwise and I would say this was a reasonably good pin.

I decided to put in a buy limit order at the 50% retracement of the pin (90.10) with a stop just below the pin nose (88.20) and looked at the 50 Fib and the pivot area as guiode for an exit (94.66). This gave me a potential risk:Reward of 190:366 or 1:1.9 and I was risking just under 2% of my account. Had I gone for a buy stop order at the break of the pin the distance between the stop was 365 pips so was only 1:1 risk reward and about 4% of my total account.

Looking at the daily bar today it has not reached my buy limit order and I am worried that I should have approached it differently as the pin has taken a long time to get anywhere near my buy level and so is likely either not to make it or keep going down.

Does any of this sound remotely reasonable on this pin? If not any comments appreciated. Has anyone else gone long on this trade?

Should this be in another forum please move for me.

Thanks

Mart
 

Attachments

  • USDJPY Pin.JPG
    USDJPY Pin.JPG
    319.2 KB · Views: 162
HI,

I was looking at the USDJPY pin last night and made a play on my demo account. Before I go on I want to say that I am new to all this and so I am only learning. I expect to make mistakes hence why I am only on a demo account and would really appreciate any comments on my thought process.

Anyway, it looked like a strong pin to me, with the long nose, short body within the range of the left eye, was at a swing low in a down trend. However, unfortunately there was no confluence as the pin bounced off a 13 year low. I would have rather had a pivot line or a fib but thought the pin looked strong otherwise and I would say this was a reasonably good pin.

I decided to put in a buy limit order at the 50% retracement of the pin (90.10) with a stop just below the pin nose (88.20) and looked at the 50 Fib and the pivot area as guiode for an exit (94.66). This gave me a potential risk:Reward of 190:366 or 1:1.9 and I was risking just under 2% of my account. Had I gone for a buy stop order at the break of the pin the distance between the stop was 365 pips so was only 1:1 risk reward and about 4% of my total account.

Looking at the daily bar today it has not reached my buy limit order and I am worried that I should have approached it differently as the pin has taken a long time to get anywhere near my buy level and so is likely either not to make it or keep going down.

Does any of this sound remotely reasonable on this pin? If not any comments appreciated. Has anyone else gone long on this trade?

Should this be in another forum please move for me.

Thanks

Mart

Hey, sorry I'm not replying much these days as pretty busy with my own trading.

Mart, just a quick note: if you are going to try and refine your entry for a tighter stop, wait until the setup is CONFIRMED in the first place. Until the high of that pin is broken, it is not a valid setup.

Best way to play it would be to either:

a) Wait for the pin high to be broken and use the appropriate stop e..g. on the other side of it. (if you can't afford to do this then pass on the setup altogether)

b) Wait for it to break the pin high and then try and buy a retracement e.g. using the 50% fib of the pin etc

c) Wait for the pin high to break and then use a lower TF e.g. hourly to enter in the direction the pin indicates (this is harder to do)

I have always done A. Use a big stop and cut your size accordingly. If you can't do this, then PASS ON THE TRADE.

B doesn't make much sense to me as although you are getting a tighter entry you are getting in when price is moving the wrong way which I never like to do and C is harder for beginners although I like to do this from time to time.

Tom
 
Eurcad

Anybody watching EurCad. Its reached a level last seen in Feb 2004 and a pin has formed on the hourly, although not the best Pin on my charts.

There's not much else to go by and I would be cautious going counter trend off the hourly but its an interesting level and may be worth keeping an eye on.

Hi Ljr

I don't know if you played this one, its triggered now. I haven't looked at this pair before, I can see the 50% retrace sitting @ 1.5747 level, which is also the last swing high. Its almost touched the 24% level (1.6872), the 38% is at 1.68. If it retraces to 50%, thats some 200 points - a large count to many shorter term traders - about double the risk (if you take the stop to entry as the total length of the hourly pin you spotted).

As you say, its against the trend, but often moves retrace somewhat, which are tradeable on the shorter timeframes.

Finally I am reminded of TDs signature (because the price is at the top of my chart), charts have tops & bottoms, prices don't !

Good luck with it if you are in, don't know if any of my comments are helpful?
Paul
 
Hey, sorry I'm not replying much these days as pretty busy with my own trading.

Mart, just a quick note: if you are going to try and refine your entry for a tighter stop, wait until the setup is CONFIRMED in the first place. Until the high of that pin is broken, it is not a valid setup.

Best way to play it would be to either:

a) Wait for the pin high to be broken and use the appropriate stop e..g. on the other side of it. (if you can't afford to do this then pass on the setup altogether)

b) Wait for it to break the pin high and then try and buy a retracement e.g. using the 50% fib of the pin etc

c) Wait for the pin high to break and then use a lower TF e.g. hourly to enter in the direction the pin indicates (this is harder to do)

I have always done A. Use a big stop and cut your size accordingly. If you can't do this, then PASS ON THE TRADE.

B doesn't make much sense to me as although you are getting a tighter entry you are getting in when price is moving the wrong way which I never like to do and C is harder for beginners although I like to do this from time to time.

Tom

Tom,

Thanks for taking the time to reply...again.:D

Fair comments and so basically if the stops mean too much risk for me then I should pass on the trade regardless of how lovely the pin looks.

A short question on the entry...How long would you wait for price to break the pin high? i.e. on the daily if the next bar does not break the pin high do you forget about it or do you wait for a few days and take the position when price breaks the pin?

Thanks

Mart

Hey Mart,

Generally if the pin isn't triggered on the next day I pull my order. There is one exception to this and that is if the next bar is an INSIDE BAR that closes not far from the place where the pin triggers the trade. This is rather discretionary though.

If I had an order in on USD/JPY, I would now pull it.

It doesn't mean it won't skyrocket tomorrow, it's just my way of doing things :)

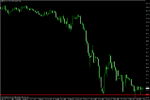
If you think the Yen is going to weaken, I would rather play CAD/JPY as this has now formed good support and there was a pin at the bottom that is still in play - infact you could get in at the place it originally triggered if you're quick!
 

Attachments

  • cad.gif
    cad.gif
    16.6 KB · Views: 213
I just noticed this setup which I fancy.

GBP/CHF.

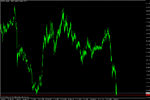
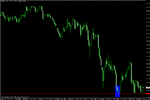
Huge weekly level (chart 1) and a daily IB (chart 2 - see arrow).

Last time we had an IB here (blux box) there was a 1,000 pip rally.

Doesn't take many of those to make you A LOT Of money :)
 

Attachments

  • gbp.gif
    gbp.gif
    23.6 KB · Views: 240
  • gbp-2.gif
    gbp-2.gif
    19.2 KB · Views: 266
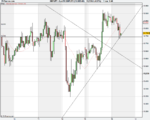
Did anyone else take this GBP/JPY trade? There seemed to be a lot of confluence with this pin, just wondered if some of the more experienced traders could give me their take on it. There was a pivot directly above it so i guess that was why it didn't work, shame because it looked quite nice. Anyway i'd be interested to hear from some of you guys...
 

Attachments

  • Spot FX GBP_JPY (15-DEC-08).png
    Spot FX GBP_JPY (15-DEC-08).png
    40 KB · Views: 189
Last edited:
Did anyone else take this GBP/JPY trade? There seemed to be a lot of confluence with this pin, just wondered if some of the more experienced traders could give me their take on it. There was a pivot directly above it so i guess that was why it didn't work, shame because it looked quite nice. Anyway i'd be interested to hear from some of you guys...

This is a good set-up in my opinion, although that pivot above the pin is the main reason it didn't work. If you were playing a more conservative game you probably would've passed on the trade, however i think this had potential due to the sterling strength yesterday and the confluence this trade exhibited. Just a bit unlucky, they don't all work out.
 
hi eric,had a look at the chart and if you up your timeframe to the daily you will see its against the trend and have a look at the lows of 24 oct,and 20 nov and draw your zone,you might see it in a different light.however a good set up in another situation you are on the right path but always check the higher time frames.good luck and happy xmas.
 

Attachments

  • gy1.gif
    gy1.gif
    24.1 KB · Views: 163
  • gy.gif
    gy.gif
    19.1 KB · Views: 195
Thanks Superspurs, yeah looking at it that way on the daily chart definitely makes it a risky trade. I appreciate your help. Happy Christmas to you too!
 
sometimes it is as easy as finding a trending pair and look for where the support is.
 

Attachments

  • eu.gif
    eu.gif
    17.6 KB · Views: 204
EURGBP looks a good short potential, run out of steam, doji yesterday, bearish divergence. If we have a red candle today it will be a good short. I am already short!, having closed half for 40 pips, now letting the rest run
 
good call,looking at it myself.lower highs DBHLC,(within a couple of pips)
 

Attachments

  • eugb.gif
    eugb.gif
    15.2 KB · Views: 201
audjpy

something cooking up on audjpy. Wedge, PPZ, round number all lined up.
 

Attachments

  • pic.gif
    pic.gif
    22.4 KB · Views: 163
  • pic2.gif
    pic2.gif
    22.1 KB · Views: 151
Hi Ljr

I don't know if you played this one, its triggered now. I haven't looked at this pair before, I can see the 50% retrace sitting @ 1.5747 level, which is also the last swing high. Its almost touched the 24% level (1.6872), the 38% is at 1.68. If it retraces to 50%, thats some 200 points - a large count to many shorter term traders - about double the risk (if you take the stop to entry as the total length of the hourly pin you spotted).

As you say, its against the trend, but often moves retrace somewhat, which are tradeable on the shorter timeframes.

Finally I am reminded of TDs signature (because the price is at the top of my chart), charts have tops & bottoms, prices don't !

Good luck with it if you are in, don't know if any of my comments are helpful?
Paul

Hi Paul

Thanks for the comments. I did actually take it. Order was at 16895. The price moved sideways for quite a while so I decided to be more conservative and placed my take profit at the 38% fib 16800 but this was missed by just a couple of pips. I had then moved my stop to BE and this was hit later on.

So nothing gained or lost.
 
Last edited:
Not really any potential set-up to mention but potentially important: With y/day's post fed rate cut Hi, Gbpusd has made a Daily chart H above last LH of it's prolonged downtrend, and breaking through the first potential sbr area on that chart. Price is up off the 4465area last LL of said downtrend.

G/L

t9jgud.gif
 
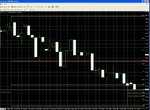
Can anyone confirm this could be a valid pin forming in opposite direction of the initial pin that started the fall at the third top ?

Current candle still incomplete, but forming at 38.2 fib.
 

Attachments

  • usdcad17.JPG
    usdcad17.JPG
    181.7 KB · Views: 199
Status
Not open for further replies.
Top