Best Thread Phil Newton's Range Break Out strategy

In your own mind NTB, what are the hours that you would define as the Asian session? I'm thinking about 2300-0700 UK time? What is your preferred time bracket to define the Asian session by?

Cheers.
 
The times you mention are about right... I dont define the asian range by time, its based on price action as per the definition in the videos... the range can start a long time before and go on a long time after the "Asian Session"

Setting a time for a range does not help much I like to think of it as the European market joining the Asian one as I am not really sure that that the Asian session gets less busy by 7 am
here is a link showing a time scale don't know how accurate it is.

FXMarketHours - OANDA FXTrade
 
Setting a time for a range does not help much I like to think of it as the European market joining the Asian one as I am not really sure that that the Asian session gets less busy by 7 am
here is a link showing a time scale don't know how accurate it is.

FXMarketHours - OANDA FXTrade

Yes, i see. Cheers.

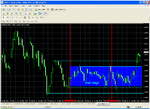
It is slightly discretionary then as eg. on this chart, the Asian range is nicely contained in the inner lines/range. However, there is also S/R close by, marked by the outer lines that came into place b4 the Asian session.
Overall though, it should be pretty easy to identify the range of price action that a BO from will cause you to show an interest in.
 

Attachments

  • asian range.gif
    asian range.gif
    46.5 KB · Views: 260
Yes, i see. Cheers.

It is slightly discretionary then as eg. on this chart, the Asian range is nicely contained in the inner lines/range. However, there is also S/R close by, marked by the outer lines that came into place b4 the Asian session.
Overall though, it should be pretty easy to identify the range of price action that a BO from will cause you to show an interest in.

I did not trade this one as I could not define the pull back and it was really trading in the middle of the range when Europe opened.
It also seemed like a down day to begin with.
Phil or Jtrader where did you define the pull back at?
 
I've not gone that far to define the pullback. At the moment the range BO is just something that i think might be useful to show/be aware of on the chart, and fit in with how i trade. Just as an extra reason for identifying movement in one direction or the other after the BO - type thing.
 
Ok,
I use a momentum indicator to give me an indication of direction that ties in with the fib ratios
 
I did not trade this one as I could not define the pull back and it was really trading in the middle of the range when Europe opened.
It also seemed like a down day to begin with.
Phil or Jtrader where did you define the pull back at?

I remebered to get a snag of it so will post it up later
 
there is no discretion at all with the method

What user A defines as their range that they want to see broken would likely be slightly different to user B, so this part of identifying what needs to happen before they start to look for the pullback entry must be discretionary??
 
What user A defines as their range that they want to see broken would likely be slightly different to user B, so this part of identifying what needs to happen before they start to look for the pullback entry must be discretionary??

I disagree but then thats whats great about different view points 😎

If you listen to the video and watch the many videos and also the read the article at the start of this thread as well as the articles on my site... you will see that the definition that I use is the same each and every day so there is no discretion in the definition I use.

Of course trade A and B may differ but that depends on how they interpret the charts and teh definitions they use.

Everything I do is rule defined if its outside that it isnt on the chart as far as I'm concerned.
 
Fib retracement ?

Hi Folks,
Today video showing my current view on the markets... looking like its going to be a long wait for a lot of patterns to set up for me.
happy trading
Phil


Hi Phil

Thanks for the video today, I like your assessment that theres not much looking to set up so take the morning off!

I have watched a few of your videos and understand (I think) the principle of the narrow 'overnight' range at either the high or low of the previous day being a good potential set up. Once this narrow range is broken (either way but 65% of the time it will be up if the daily trend is up) you wait to see where its high is, let it fall back down and as it climbs up again you have the place for your order to trigger open (the break out) your stop (the low of the 'fall back down', which will be somewhere with in the 'narrow range' and your target (average daily movement over the last 100 days). In theory at that point you can walk away (the order will either trigger, or it wont, if it does it will either hit the target or the stop). Please tell me (if you can understand that) if I have picked up the important parts of your strategy correctly?

Now, today you talk a lot about the fib retracements. Do these have anything to do with the above, or is this a method you use for managing the trade once it opens, or is it a different strategy. If today the EURUSD has done its average days move, and you are looking for a fib retracement, where are you taking the fib from (yesterdays low 1.4600) and to (todays high 1.4770) which gives you 4 levels that the down trend (revesal) may stop at (1.4730; 1.4706; 1.4686 - nearly there; 1.4667). Do you look for something at one of these levels to indicate that you can trade long? If so how do you set stop & target?

Sorry to take up so much space on your thread. If you feel its too off topic, can you pleasde reply to me privately?

thanks
Paul
 
Hi Paul not a problem at all...

I mention fibs as that is what is setting up a lot over the last several weeks

It is a different strategy which leans away from the theme of this thread which is about break outs.

I talk about them a lot at the moment as there have been too many regular break trades setting up recently due to all the recent volilitility.
 
Hi Folks,


Find myself with a lot of free time today


Today is one of those days where I look at the charts and thing stuff it.


Price activity in the overnight or Asian trading range is not in the best place to be taking trades on as far as I'm concerned OR there are still some larger term ranges that still need to be broken before any action can be taken. AND when that happens I will need to take an average days move into consideration which means waiting yet again for more significant retracements using fibs and at least a 50% retracement.


Long story short I dont fancy sitting all day just on the off chance that something might develop from what will most likely be scraps for the day.


Now this doesnt mean we cant or will not see some good moves it just means that based on market norms and averages I have a low expectation of being able to join in on any moves based on the strategies I use.


Other traders with different style may be looking at this and thinking this is perfect for my strategy but that just highlights the magical difference between traders and strategies.


Have a good days trading folks

Phil
 
Phil

Probably the reason FX has been subdued lately is because the big allocation decisions are being postponed until the rescue plan of the "toxic assets"becomes clearer.

Cheers
Lee
 
Last edited:
Back
Top