Pairs Trading UK & US Stocks Journal

stocky, thanks for all that , IE screen shot and so on..
I guess it is more like a swing strategy..
But
-did you ever got in and out of a trade in a day ?
-how do you take your profit ? in % ? in $? other ?
-do you average ? i mean you go long and short one day and then you ad long / short a day or 2 latter ?
-do you scale in ?
-do you scale out ?

thanks

it is not because things are difficult that we do NOT dare them. It is because we do not dare them that they are.
Seneca
 
Can you go into more detail about the maths of your trades?

How are you determining the correlations, how you consider a divergence significant to trade? That kind of thing...

Great thread.
 
stocky, thanks for all that , IE screen shot and so on..
I guess it is more like a swing strategy..
But
-did you ever got in and out of a trade in a day ?
-how do you take your profit ? in % ? in $? other ?
-do you average ? i mean you go long and short one day and then you ad long / short a day or 2 latter ?
-do you scale in ?
-do you scale out ?

Yes Im swing trading pairs, don't like day trading anymore its a very slim margin game. I close positions when a exit signal is triggered by the software. Currently I don't scale into my trades, just 1 layer does me fine.
 
Can you go into more detail about the maths of your trades?

How are you determining the correlations, how you consider a divergence significant to trade? That kind of thing...

Great thread.

I don't do any math or determine correlations, etc.....Ive got software to do that for me, I simply follow the entry and exit signals and focus on staying consistent and keeping the risk spread out. I set my standard deviation at 2.00, i.e.......I get entry signals when a pair diverge's 2 stdev from its mean, also I only watch pairs above 80% correlation.
 
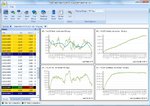
Closed 1st trade of the journal with very nice profits made on both legs, this was the shipping pair trade I placed 2 days ago.

Sold SFL - 11.58 (went long at 10.94)

Covered VLCCF - 14.74 (went short at 16.54)

Have a great weekend everyone.
 

Attachments

  • SFL-VLCCF_Exit.jpg
    SFL-VLCCF_Exit.jpg
    139.7 KB · Views: 358
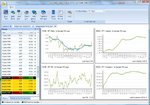
Entered trade, a pair from Oil & Gas Sector on the NYSE,

Long Entry SFY - 15.89

Short Entry ROSE - 7.14
 

Attachments

  • ROSE-SFY.jpg
    ROSE-SFY.jpg
    136.9 KB · Views: 448
I don't do any math or determine correlations, etc.....Ive got software to do that for me, I simply follow the entry and exit signals and focus on staying consistent and keeping the risk spread out. I set my standard deviation at 2.00, i.e.......I get entry signals when a pair diverge's 2 stdev from its mean, also I only watch pairs above 80% correlation.

OK - Spam alert.

Seems to me you are blindly following the calls your software makes for you.

Over what period are your correls + S.D generated from? Do you bootstrap the data?
 
Gecko, I am not spamming.

I filter the entry signals according to my own discretion, news announcements, what industry the signal is from, etc...I do follow the exit signals blindly though, I measure correlation using 100days and have signals been generated at 2 standard deviations from the mean,

what do you mean by bootstrap the data?
 
I'll also pipe up and say it's a great bit of software if you don't want to plug the data into excel yourself.

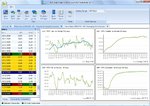
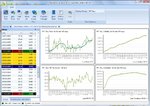
It's not a magic black box indicator. Pairtrade finder uses a 14 period daily Moving average as the mean on the ratio chart and then fires a signal if a number of standard deviations is touched (a bollinger band) This can be set to your preference. EG: 2 as ST77 uses.
Draw a 14 period 2SD BB on any of the ratios mentioned and you'll see the same signal. It's just pairtrader packages in a user friendly way and has the handy feature of backtesting all the pair correlations for you.

As stocktrader has mentioned the art in picking pairs is not in just the signal but also the pattern of the ratio chart. Tweak it with an rsi/stoch oscillator on the ratio chart and/or an osciallator on the individual stocks as required.

My only gripe with it is the inability to connect to your own realtime data feed.

Great thread by the way StockTrader, interesting to see some new pairs popping up into the radar.
 
Everything you said is spot on Haddock, as you mentioned its important to filter trades no matter what the system, thats what makes a great trader, a balance of systematic & discretionary application.
You can use real time data, Ive got IQfeed, although its only available with US stocks, I still use the free data feed for UK stocks. Glad to hear from another pair trader, there's not too many of us out there, any other practitioners are welcome to contribute to this journal, we may make something really useful for all of us.

Closed 2nd trade in the journal for good profits on both legs;

Sold BEZ - 13.83 (went long at 13.01)

Covered AIMC - 6.75 (went short at 7.25)

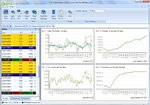
Opened 1 new trade, a US paper & products pair, what I like about this trade is not only the high correlation at 97.34%, but a sideways ratio chart at resistance levels and a nice ratio/rsi divergence, ive marked in the divergence for all to see.

Long Entry IP - 7.68

Short Entry BKI - 3.32

Haddock, what industries are you finding good pairs/trades in recently?
 

Attachments

  • BKI-IP.jpg
    BKI-IP.jpg
    133.2 KB · Views: 342
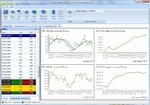
Opened 1 new trade in the US Oil & Gas Drilling Industry.

Long Entry BPZ - 3.51

Short Entry PDC - 4.72

Pair is currently more than 2.70 standard deviations from its mean.
 

Attachments

  • BPZ-PDC.jpg
    BPZ-PDC.jpg
    135.7 KB · Views: 355
Hi Stock,

Nice trading.

UK miners have given a few nice trades. You've got to watch your position size on those though, they do swing pretty wildly.
I'm taking much more care over position sizing with those, noting the percentage change required to revert to the mean and adjusting to suit my tolerance.
 
Opened 2 new trades, 1 pair in the US Property & Casualty Insurance Industry and another in the US Packaging & Containers Industry.

Long Entry ACE - 42.33

Short Entry ACGL - 63.42
-------------------------------------
Long Entry MWV - 10.85

Short Entry GEF - 32.17

Both pairs are more than 2.3 standard deviations from their means.
 

Attachments

  • GEF-MWV.jpg
    GEF-MWV.jpg
    137.6 KB · Views: 402
Exited one trade today

Sold OSG - 30.02

Covered TNK - 10.58

entered new trade in a oil drilling pair

Long Entry WLL - 26.91

Short Entry HP - 21.75
 

Attachments

  • HP-WLL.jpg
    HP-WLL.jpg
    137.2 KB · Views: 326
Exited two trades for profit on both pairs

Sold CMCSA - 12.99 (went long 13.74)

Covered SJR - 15.00 (went short 16.51)

------------------------------
Sold ACE - 40.75 (went long 42.33)

Covered ACGL - 55.78 (went short 63.42)

So far in the journal->

Trades: 12
Closed: 5
Wins: 4
Losses: 1
Profit: $17,809

I trade 50k each side of the pair.
 
Top