Open trade in NEN

ducati998

Experienced member
Messages
1,196
Likes
68
Entry Price .................................$75.80
Position .....................................500 shares
Stoploss....................................No stoploss
Exit Target.................................$227.76

This is an interesting chart for all the charties.
I personally HATE this chart for my entry, however, the trade was taken on a Fundamental basis, so........................

The other more serious concern, is that this is in the "housing market", which is frothy to say the least, but we'll see.

It would not surprise me to see on the "chart" a further drop in the short-term, this really has the potential to have some short-term downside and pain.

Here is a synopsis of the business;

New England Realty Associates Limited Partnership (NERA) is engaged in the business of acquiring, developing, holding for investment, operating and selling real estate. NERA, directly or through 24 subsidiary limited partnerships or limited liability companies (collectively, the Subsidiary Partnerships), owns and operates various residential apartment buildings, condominium units and commercial properties located in Massachusetts and New Hampshire. NERA owns between a 99.67% and 100% interest in each of the Subsidiary Partnerships, except in three limited liability companies, in which the Company has a 50% ownership interest. As of February 25, 2005, NERA and its Subsidiary Partnerships owned 2,396 residential apartment units in 23 residential and mixed-use complexes.
 
Here are some of the financial ratio's used in a Fundamental assessment.

VALUATION MEASURES

Market Cap (intraday): ...........................................................................................13.00M
Enterprise Value (16-Jun-05)³:......................................................................... 116.60M
Trailing P/E (ttm, intraday): ........................................................................................1.83
Forward P/E (fye 31-Dec-06)¹:................................................................................... N/A
PEG Ratio (5 yr expected):.......................................................................................... N/A
Price/Sales (ttm):....................................................................................................... 0.42
Price/Book (mrq):....................................................................................................... 0.84
Enterprise Value/Revenue (ttm)³:........................................................................... 3.76
Enterprise Value/EBITDA (ttm)³: ...........................................................................7.362


FINANCIAL HIGHLIGHTS

Fiscal Year
Fiscal Year Ends: 31-Dec
Most Recent Quarter (mrq): 31-Mar-05


Profitability
Profit Margin (ttm): .......................................................................................................23.22%
Operating Margin (ttm): ..............................................................................................30.96%


Management Effectiveness
Return on Assets (ttm): ...............................................................................................4.45%
Return on Equity (ttm): .................................................................................................9.62%


Income Statement
Revenue (ttm): ...........................................................................................................31.05M
Revenue Per Share (ttm): ......................................................................................179.243
Qtrly Revenue Growth (yoy):...................................................................................... 2.40%
Gross Profit (ttm): ....................................................................................................20.68M
EBITDA (ttm): ............................................................................................................15.84M
Net Income Avl to Common (ttm): ..........................................................................1.37M
Diluted EPS (ttm): ......................................................................................................41.61
Qtrly Earnings Growth (yoy): ...............................................................................960.70%


Balance Sheet
Total Cash (mrq): ...................................................................................................12.49M
Total Cash Per Share (mrq):................................................................................ 72.807
Total Debt (mrq):................................................................................................. 116.13M
Total Debt/Equity (mrq):.......................................................................................... 7.522
Current Ratio (mrq):................................................................................................ 7.482
Book Value Per Share (mrq):....................................................................... 90.010002


Cash Flow Statement
From Operations (ttm): .......................................................................................7.88M
Free Cashflow (ttm):............................................................................................ 8.10M


Beta: ........................................................................................................................N/A
52-Week Change: ............................................................................................22.76%
S&P500 52-Week Change:.............................................................................. 6.44%
52-Week High (09-Feb-05):.............................................................................. 97.40
52-Week Low (16-Jun-04):............................................................................... 59.64
50-Day Moving Average:.................................................................................... 85.66
200-Day Moving Average:................................................................................. 90.33


Share Statistics
Average Volume (3 month): .......................................................................1,615.38
Average Volume (10 day): ...........................................................................1,162.5
Shares Outstanding: ...................................................................................171.00K
Float:.................................................................................................................... N/A
% Held by Insiders:........................................................................................... N/A
% Held by Institutions: ................................................................................0.80%
Shares Short (as of 10-May-05):..................................................................... 0
Short Ratio (as of 10-May-05): .........................................................................0
Short % of Float (as of 10-May-05): .........................................................0.00%
Shares Short (prior month):............................................................................. 0


Dividends & Splits
Dividend (ttm): .................................................................................................2.80
Dividend Yield (ttm): ....................................................................................3.71%
Dividend Date: .......................................................................................30-Jun-05
Ex-Dividend Date:.................................................................................. 14-Jun-05
Last Split Factor (new per old)²:................................................................. N/A
Last Split Date:.............................................................................................. N/A

Now some of these figures do not calculate correctly.
EPS.................................................$9.14 by my calculation, not $41 odd
Shares Shorted.............................0...........don't think I've seen that before, but will have to check on that one.

Consider the huge disparity between "ENTERPRISE VALUE & MARKET VALUE", just a mere $103M............the market does not even know this stock exists.

Institutional investment............miniscule.
For the Technical boys who's mantra is "the trend is your friend" check out the chart. ( if any one can post a chart for me cheers )

cheers d998
 
Last edited:
Taking lessons from Mr Buffet again hey.

"Entry Price .................................$75.80 "

"Total Cash Per Share (mrq):................................................................................ 72.807 "

do you have a view on timeframe , or you just in on the 'cheap' with little risk and relatively lots of potential upside ?
 
chump,

Well spotted, ( as regards cash/share, although this has changed since the last annual report, they have expanded the asset base. ) yes this is a longer-term trade, the upside projection is enormous, with an appraised value at $227.76. This is a conservative valuation, and still returns a potential 192% return, excluding dividends.

The cash per share, is actually perceived by Value hounds as a potential negative. The reason being that "Cash" earns only a low return. It needs to be invested in an asset, that has the ability to earn a higher return. However, to get in with the cash on the books at a low price, and reap the rewards of higher earnings as that cash is invested, is a very sound strategy, which is why you would look very closely at profitability.


cheers d998
 
Maybe I am missing something here or probably it is time to get a pair of spectacles.

As Chump has pointed out cash of $72 (changed since last published figures) versus a share price of roughly $76? The trailing PE is less than 2? Okay, what is the PE ratio once the cash is stripped out? Are the shares near the bottom of their 52 week range? Why have the big hitters missed this one?

You have out done yourself this time old boy.
 
this looks like a decent punt to me although I'd like to know more about their product portfolio..where it is positioned in the market...

I don't know how theorist fundies see cash..but to me it looks like a very nice low risk backstop.....

I don't see how this can lose logically ,but who knows for sure....you see if the market being frothy means they have to write down asset value in future without any significant loss of revenue stream then their stats will look better...however even before that eventuality a frothy market in housing means a portion of people who might otherwise be buying rent instead...depending on supply and demand in their locality this might offer the opportunity for rents to increase in which case their stats look better..this happens at the middish to lower end..higher than than that it does not work because people in that income strata are not effected to any significant degree by this type of market..so to some degree it looks like a win win ..as usual time will tell

Tried to upload a chart but it appears to be in the wrong format so no luck..but on the surface technically (you love that don't you) it's approaching a very nice pull back opportunity although technically at this moment it still (without the cash) looks like a falling knife. technically ;) I'd have liked to see it slowing up a bit first because I think it will go further in which case technically ;) you'd have an opprtunity to catch this at the same price on an upswing

Lion ..near the bottom of their 52 week range? ..yes they are
Cheers
 
LION,

Here are the holders of note;

BREAKDOWN

% of Shares Held by All Insider and 5% Owners:.................................................................. NaN
% of Shares Held by Institutional & Mutual Fund Owners: .................................................... 1%
% of Float Held by Institutional & Mutual Fund Owners:........................................................ 1%
Number of Institutions Holding Shares: ..................................................................................... 3


MAJOR DIRECT HOLDERS (FORMS 3 & 4)

Holder Shares Reported
BROWN, HAROLD ..............................................31,061................................................... 26-Aug-04
( This is the CFO )


TOP INSTITUTIONAL HOLDERS

Holder Shares ....................................................% Out ................................................Value* Reported
WEIL (Christopher) & Company, Inc. ..............14,000...8.08 ......................$1,302,000 31-Mar-05
UBS Securities LLC ............................................1,232.... 0.71......................... $114,576 31-Mar-05
Boston Trust & Investment Management Co. 200....... 0.12............................ $18,600 31-Mar-05

They have simply missed it, just too small.
There are only 173,000 shares in the Capitalisation
The Bonds @ Par.............$115M

The leverage available for the Common is simply enormous.
The correct earnings are $9.14, not the reported $41 odd.
The mistake seems to be contained in the cashflow statements, which reveal that they spent down cash just recently expanding the asset base, which are properties generating "Rental" income.

The cash came from surplus and increased debt, so over the next year or so, earnings should expand again.

The low dividend rate has also disguised this stock, as the yield is only 3.5% odd.
The correct P/E should be 8.26..........which is still very acceptable.

cheers d998
 
LION,

I see what they have done, they are using a ttm P/E.
I am using last years Annual Figures.

Earnings Per Share - ...Quarterly Results ........FY (12/05)........ ....FY (12/04)................. FY (12/03)
.................................................1st Qtr ........................$35.66 ....................$3.36 .........................$8.50
................................................2nd Qtr............................. NA .....................$4.83.......................... $8.17
.................................................3rd Qtr............................. NA ......................$1.21........................ -$4.87
.................................................4th Qtr............................. NA...................... -$0.09......................... $4.18
.................................................Total............................ $35.66.................... $9.31....................... $15.98

This years earnings will have the potential to be huge, as in the Q1 they have already earned $35 + $9.31 = $44.97 ( less tax, which is probably deferred at the moment ) will give you your $41.00 earnings and a ttm P/E of 1.84.............an absolute steal!

cheers d998
 
=ducati998I personally HATE this chart for my entry, however, the trade was taken on a Fundamental basis, so........................
Glad you said that. looks like an odd entry from a technical perspective, though obviously I appreciate it isn't a technical trade. not so good on a daily basis, though I always hate charts of stocks that trade this thinly. Weekly is a bit ropy as well, nice rounding top there. Looks to me like if this gets below $67 then its going to $57. Then you got nearly a years worth of consolidation between $52 and $60 as support, Been a monster over the last 6 or so years.
Will be interesting to follow this one.
 
ROGUE,

Any chance of a chart for the techies when you have 5mins spare?
It would be interesting, although I won't hold my breath to get other "technical" viewpoints.

From a Fundies point of view this is a pretty low risk trade.
cheers d998
 
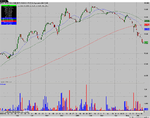
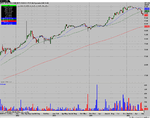
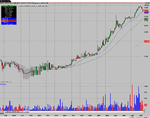
Daily weekly and monthly charts

The trend is your friend, but watch out for the bend at the end.
 

Attachments

  • NEN daily.png
    NEN daily.png
    46.2 KB · Views: 215
  • NEN weekly.png
    NEN weekly.png
    46.1 KB · Views: 226
  • NEN monthly.png
    NEN monthly.png
    42 KB · Views: 230
Last edited:
ROGUE

Top man thanks.
Actually just had a look at the "Daily" and that makes me feel much happier.
On the monthly, the consistent rise just makes me uneasy.

cheers d998
 
Doesn't look from those that you will have to wait that long to find out what comes next ..
 
ducati998 said:
ROGUE

Top man thanks.
Actually just had a look at the "Daily" and that makes me feel much happier.
On the monthly, the consistent rise just makes me uneasy.

cheers d998

LOL from a non fundamental view it looks high risk and that is one of the reasons, as I said its been an absolute monster since about 2000, gone from around $11 to $97. One thing I do see looking at the monthly is that it has touched the 20 month sma but hasn't had a monthly close below it since Feb '96 that currently sits at $73.59, of course it had been observing the 50 week sma quite well as well
 
CHUMP & LION63

It would seem that the cash per share is correct, at $72 per share.
The huge inflow from Q1 results has swelled surplus.

The EPS from 2004, was from the reinvestment of surplus & increased borrowing, and of course if buildings are occupied, then cashflow as rent will be immediate.

It will be interesting to see how this cash is used.
This management, Father & Son team are obviously well switched on.
Their profitability is outstanding, and their costs well managed.

cheers d998
 
The Competition

Just some comparison shopping;

DIRECT COMPETITOR COMPARISON

........................................ NEN ...............................ASN ....................HME .......................Industry
Market Cap: ................12.91M .........................7.59B ...................1.34B ........................90.05M
Employ*ees:.................... 45............................... 2,640 ..................1,600 ..............................75
Qtrly Rev Growth (yoy): 2.40% ........................17.50%................. 7.70%....................... 4.70%
Revenue (ttm): ...........31.05M .......................924.89M .............466.31M......................... 70.07M
Gross Margin (ttm):.... 55.29%...................... 65.79%............... 55.63% ........................47.06%
EBITDA (ttm): ..............15.84M .....................562.45M ..............246.21M .........................12.14M
Oper Margins (ttm): ...30.96% ......................35.92%................ 31.20%........................ 13.55%
Net Income (ttm): ........1.37M ......................142.11M................ 27.17M.......................... 2.31M
EPS (ttm):.................... 41.613 ........................2.521..................... 0.995 ............................0.31
P/E (ttm): ........................1.81 ..........................15.14..................... 42.90 ............................22.07
PEG (5 yr expected):.... N/A .............................3.90 .......................4.20.............................. 1.67
P/S (ttm): ......................0.42.............................. 8.22 .......................2.89.............................. 2.57

Tells an interesting story
cheers d998
 
Cash in the bank will definitely limit the downside of this one, if the shares were to slip the vulture funds will wade in dismember it. On the other hand, once the next quarterly results are released the shares will rise significantly provided the numbers are even static.

This is heading higher unless external factors were to take a dramatic turn for the worse. Even then, things would have to be very poor for the shares to fall substantially below the cash balance.

It is a real tiddler compared to the others that you have shown but the numbers tell the story. This is going to grow much faster than they will. Quite frankly the low rating can be put down to the market capitalisation, how many funds will even give it a second glance? The list of shareholders says it all.

Fundamental analysis is all about spotting value ahead of the crowd and not piling in after the so called "smart money". When those people start buying, it is already time to look for the exit signs.
 
Shares Shorted.............................0...........don't think I've seen that before, but will have to check on that
That surprised me until I saw the float.
Probably accurate, with such a small float you may not be able to borrow these to short them
 
So, our two fundamental analysts both agree that downside is limited and the stock appears to be a steal at this level. From what you both have said it all seems logical.
Am I reading the stats right, there are only 171,000 shares in the float. If so I suspect that is the reason that institutional ownership is almost non-existant, not enough shares to go round.

Technically, looking at the monthly as previously said the stock has been a monster rising nearly 9 fold in five years.Stock is approaching its 20 month sma, last close below this was in Feb 1996, seemed to observe this MA quite closely "riding" it until 2000, Dec '02 was the next contact when it sold down to this MA and bounced after an unsettled couple of months. This MA now stands at $73.59 currently and would be first point of potential support as it seems to have acted that way before. Over a 12 month period the average monthly volume has been 49,258, as such recent selling has not been excessive.

Looking at the weekly chart, volume pattern suggest volume may be drying up here as volume has fallen by close to 75% this week and last week compared to the prior two weeks, this would be a positive. IMO. If support of the 20 month sma is not forthcoming here, then there may be horizontal support at $67.50 which marks the low of a bull flag from mid Aug '04 Failing that and we are looking at the 200 week sam currently at $55.69 which also falls in a one year trading range of $50-$60 mid '03 to mid '04

Daily chart is plain ugly, as Chump has already said "catching falling Knives" springs to mind, the close today seems to match that of a low of a bull flag from mid September last year, but on this type of stock I would not expect that type of support to be meaningful.

So that is my thoughts from a technical view. Not big on indicators so can't hel with those. I've never looked at the technical picture in a stock that trades this thin and wonder how much use they would be.even from the perspective of someone who accepts technicals as a useful tool.
 
ROGUETRADER

Thanks for the analysis.
In the final equation, what as a "technical trader" would you do,

Go long, with a stop @ ?
Go short with a stop @ ?
Stand aside currently, and place on a watch list for a possible entry after further study ?

cheers d998
 
Top