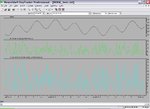
Thanks for this info, it is very valuable for a new users. Meanwhile I repeated the test on GOLD5 and also achieved very good hit - 80%. So for this level of noise NOXA outperformed MACD (30%) a lot !!! Than it confirms my statistic from post 94 that with high noise it performed well. Last result S=2.5, N=80 ==> -15db (calculation based on maks amplitude)
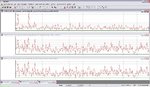
Any special reason that you don't want to repeat test using multiplication of random numbers ??? It's much easier than create the time series. Noise from GOLD5 is a gauss noise, multiplication of random numbers will not have a gauss distribution and will be more similar to market noise I think but I will check it ?
For curiosity. How did you measure S/N ratio of GOLD5. Just checking others .csv to find amplitude or you have a tool ??
Krzysztof
>> So for this level of noise NOXA outperformed MACD (30%) a lot !!! Than it confirms my statistic from post 94 that with high noise it performed well
The logic tells me that it should be better with less noise... We'll see...
>> Any special reason that you don't want to repeat test using multiplication of random numbers ??? It's much easier than create the time series. Noise from GOLD5 is a gauss noise, multiplication of random numbers will not have a gauss distribution and will be more similar to market noise I think but I will check it ?
I am now going through your data... The only way to avoid comparing oranges and apples is to use the same data... Send me your data if you want... I have no objections to my own tests but I won't try to duplicate your tests again. No other reasons.
Noxa