Noxa indicators for Neuroshell

Krzysztof,

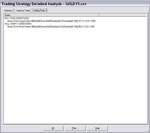
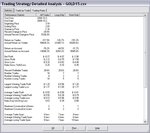
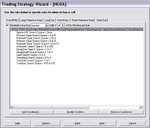
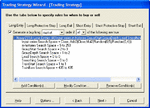
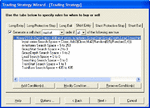
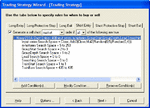
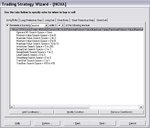
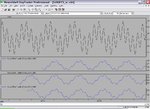
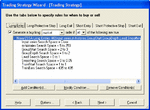
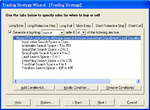
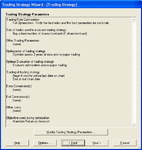
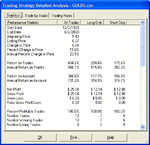
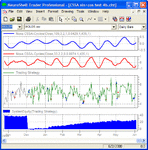
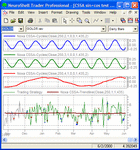
Just out of curiosity: is NeuroShell Trader new to you? You seem to do something wrong with it. The problem you are looking at is trivial for CSSA. You should get 100% profitable trades on out-of-sample data 100% of the time in the limit of reasonable noise. We did the test up to 6dB of noise (see screenshots). Would you please communicate your long and short entry rules as well as all the details of your strategy parameters?

Noxa

Krzysztof,

Futher to post #96, how long have you been using NeuroShell Trader?

Noxa
 
GA optymizatio

I can see what goes wrong. You did not set the parameter ranges for the optimization; I suggest that you check the validity of the values the Genetic Algorithm produced to assess the quality of your model. The GA produced the following values:

- Long entries:
m-histories = 24: fine
means that the slowest cycle CSSA can see is 48 bars wide

GroupStart = 3: fine
Means that the GA choose the third cycle in the decomposition which counts four cycles (use ShowEigenvectors to know the number of cycles that are likely to not be noise).

GroupDepth = 1: fine
I suggest that you reduce this range to avoid overfitting.

Lead = 2: wrong
Since CSSA cycles do not lag a lead of 2 is very suspicious. We suggest that you set the range to 0 or to 0~1

Smoothing = 0.86: very wrong
This one alone tells that your model is not valid. You should not expect anything more that 0.1 for this parameter. I suggest that you set this range to 0 as well. Our experiment works just fine (100% profitable entries) even with noise.

TrainStart = 1
TrainBars = 435
I don't know whether 435 bars for training is enough to learn the slow cycle correctly. I'll give it a try.


- Short Entries
m-histories = 151: fine
means that the slowest cycle CSSA can see is 302 bars wide

GroupStart = 9: very wrong
The GA picked a cycle that is noise (Use ShowEigenvector)

GroupDepth = 1: fine

Lead = 0: fine

Smoothing = 0.96: very wrong
Confirming that your model is not valid

TrainStart = 1
TrainBars = 435
Same that above which is good

To wrap up on this. You did not set the parameter ranges so the system was poised to fail. All the results you reported so far are not valid. I won't do the analysis for your post 98. You get the idea.

Noxa

Hi,

So it seems that GA can make major errors during optymization. I will recalculate the statistics considering tips from above.

Do you have maybe a document directly related to NS optymization with GA which would explain more of this 'secrets' for example why

Smoothing = 0.86: very wrong
This one alone tells that your model is not valid. You should not expect anything more that 0.1 for this parameter. I suggest that you set this range to 0 as well. Our experiment works just fine (100% profitable entries) even with noise.


or

Lead = 2: wrong
Since CSSA cycles do not lag a lead of 2 is very suspicious. We suggest that you set the range to 0 or to 0~1


Regarding Lead parameter itself. In NS when you set LEAD>0 in TS, trading signals and TS strategy is calculated on the value delayed by LEAD bars, trading signals are printed LEAD bars delayed in real time. What will happen if I will set it for NOXA.
Will be statistic valid and signals printed in real time ??

Krzysztof
 
S/N -9db again

I can see what goes wrong. You did not set the parameter ranges for the optimization; I suggest that you check the validity of the values the Genetic Algorithm produced to assess the quality of your model. The GA produced the following values:

- Long entries:
m-histories = 24: fine
means that the slowest cycle CSSA can see is 48 bars wide

GroupStart = 3: fine
Means that the GA choose the third cycle in the decomposition which counts four cycles (use ShowEigenvectors to know the number of cycles that are likely to not be noise).

GroupDepth = 1: fine
I suggest that you reduce this range to avoid overfitting.

Lead = 2: wrong
Since CSSA cycles do not lag a lead of 2 is very suspicious. We suggest that you set the range to 0 or to 0~1

Smoothing = 0.86: very wrong
This one alone tells that your model is not valid. You should not expect anything more that 0.1 for this parameter. I suggest that you set this range to 0 as well. Our experiment works just fine (100% profitable entries) even with noise.

TrainStart = 1
TrainBars = 435
I don't know whether 435 bars for training is enough to learn the slow cycle correctly. I'll give it a try.


- Short Entries
m-histories = 151: fine
means that the slowest cycle CSSA can see is 302 bars wide

GroupStart = 9: very wrong
The GA picked a cycle that is noise (Use ShowEigenvector)

GroupDepth = 1: fine

Lead = 0: fine

Smoothing = 0.96: very wrong
Confirming that your model is not valid

TrainStart = 1
TrainBars = 435
Same that above which is good

To wrap up on this. You did not set the parameter ranges so the system was poised to fail. All the results you reported so far are not valid. I won't do the analysis for your post 98. You get the idea.

Noxa

Hi,

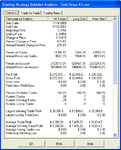
Than I fixed it according to your tips. It didn't help at all. PF MACD 0.87 NOXA 0.25.
And ??

Krzysztof
 

Attachments

  • NT1.JPG
    NT1.JPG
    41.3 KB · Views: 429
  • NT2.JPG
    NT2.JPG
    75.6 KB · Views: 350
  • NT3.JPG
    NT3.JPG
    26.1 KB · Views: 406
  • NT4.JPG
    NT4.JPG
    60.5 KB · Views: 419
  • NT5.JPG
    NT5.JPG
    60.5 KB · Views: 414
100% profitable trades again

Hi,

Than I fixed it according to your tips. It didn't help at all. PF MACD 0.87 NOXA 0.25.
And ??

Krzysztof

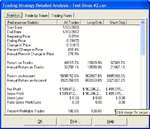
I duplicated exactly your setting and got 100% profitable trades again!!

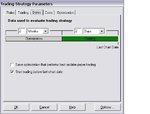
I'd like to see a screenshot of your Trading Strategy Parameters and the equity lines for both the EMA crossover and CSSA. Can you also attach a csv of your input?

Noxa
 

Attachments

  • z6.gif
    z6.gif
    15.2 KB · Views: 470
  • z4.gif
    z4.gif
    16.8 KB · Views: 530
  • z3.gif
    z3.gif
    16.8 KB · Views: 481
  • z2.gif
    z2.gif
    18.7 KB · Views: 580
  • z1.gif
    z1.gif
    27.7 KB · Views: 623
Petty, I can not open your chart. I use NS 5.3 yours is done by 5.5 but I will try to recreate the cycle with your setting anyway.

Do you know maybe some trick (if exist) how to open charts made by higher revision of NS. Hexeditor and change the string version i tried already.

Krzysztof

Ask Ward System Groups for the last NSDT upgrade (5.6). It's free of charge.

As for getting our KS package, ask our technical support:
Noxa Analytics Inc :: Your Predictive Edge

Noxa
 
100% profitable trades

Hi,

Than I fixed it according to your tips. It didn't help at all. PF MACD 0.87 NOXA 0.25.
And ??

Krzysztof

Krzysztof,

This time I have replaced the Gaussian noise I was using so far with the noise you are using: Add2(close, Mul2( Random (0,2), Random(0, 1))); results came out identical with 100% profitable trades.

I am awaiting for the csv file of your input...

Noxa
 

Attachments

  • zzz1.gif
    zzz1.gif
    25.5 KB · Views: 501
  • zzz2.gif
    zzz2.gif
    15.2 KB · Views: 431
  • zzz3.gif
    zzz3.gif
    15.6 KB · Views: 392
  • zzz4.gif
    zzz4.gif
    15.6 KB · Views: 437
My chart

Hi,

CSV files are in post 78

I believe you are making error here. Compare my setting and yours. Optimizer will
change the maximum of random numbers so we will have 100% hit, you didn't fixed it so
noise amplitude will not be 20 !!!

You didn't post trading rules like me which are different after optimization than input
values !!!!

Just rerun my chart and post results. It has data saved

Krzysztof

P.S. Out of couriosity. How long you are using NS ?? :p
 

Attachments

  • zzz4.gif
    zzz4.gif
    15.6 KB · Views: 411
  • NT4.JPG
    NT4.JPG
    60.5 KB · Views: 410
Last edited:
slow cycle recovery

Hi NOXA,

I tried to reproduce your charts but I'm not able to insert in such easy way for example
sin (.1x) + cos(.5x) as you did, i dont have in NS KS Gaussian random numbers also. My signal has only 600 bars length and you suggested to use 750 bars. Can you post your charts and maybe indicator with gaussian numbers and this which allows to insert math
functions in such easy way ??

With 600 bars and your settings it was not possible to recreate slower cycle. See screenshoots.

Krzysztof

Hi,

I tried to recover slow cycle but never succeded, i tried a few settigns which you posted. See screenshot.

So we have obvious bug here. The difference is:

I have NS 5.3 you NS 5.5
My series are generated by generator, yours I believe by KS package

So can you rerun my chart in your enviroment so we will see where the fault is

Chart with data is attached.

Any chances to get settings for EURUSD for example to start real out of sample test.
From previous post is obvious that GA can not optimize NOXA and there is a lot of details of settings which meaning are unknown.

Krzysztof.
 

Attachments

  • sc.JPG
    sc.JPG
    110.5 KB · Views: 451
  • GOLD15_sc.zip
    5.4 KB · Views: 242
Hi,

CSV files are in post 78

I believe you are making error here. Compare my setting and yours. Optimizer will
change the maximum of random numbers so we will have 100% hit, you didn't fixed it so
noise amplitude will not be 20 !!!

You didn't post trading rules like me which are different after optimization than input
values !!!!

Just rerun my chart and post results. It has data saved

Krzysztof

P.S. Out of couriosity. How long you are using NS ?? :p

I'll double check what I did late yesterday in trying to emulate your noise.

Sorry I can't run your chart. We use the EOD version of NeuroShell.

p.s We have been using NST for way more than 4 weeks...
 
Hi,

I tried to recover slow cycle but never succeded, i tried a few settigns which you posted. See screenshot.

So we have obvious bug here. The difference is:

I have NS 5.3 you NS 5.5
My series are generated by generator, yours I believe by KS package

So can you rerun my chart in your enviroment so we will see where the fault is

Chart with data is attached.

Any chances to get settings for EURUSD for example to start real out of sample test.
From previous post is obvious that GA can not optimize NOXA and there is a lot of details of settings which meaning are unknown.

Krzysztof.

So why don't you update to NST 5.5? It's free...

How can you find the slow cycle? You didn't even attempt to set the m-histories parameter! You have to find it yourself. Your setting will be different on your system as you use different data. The point I made is that you should be able to find several values of m-histories all separated by the same amount of bars which is half the period of the slow cycle.

Noxa
 
EOD !!! no real time !!!

I'll double check what I did late yesterday in trying to emulate your noise.

Sorry I can't run your chart. We use the EOD version of NeuroShell.

p.s We have been using NST for way more than 4 weeks...

Hi,

You said you use EOD NST. Than did you test your indcators on intraday data before release or real time ??

Why you assumed that they will work when most likely you never test them intraday because simply you don't have NSDT ??

Or maybe they are only for EOD data ?? It's nowhere written this. Can you tell something
about this ??

So what about those exact settings for EURUSD EOD for out of sample test ??

Krzysztof
 
slow cycle recovery

So why don't you update to NST 5.5? It's free...

How can you find the slow cycle? You didn't even attempt to set the m-histories parameter! You have to find it yourself. Your setting will be different on your system as you use different data. The point I made is that you should be able to find several values of m-histories all separated by the same amount of bars which is half the period of the slow cycle.

Noxa

Hi,

I should get upgrade today. I used your settings because I assumed we are analyzing the same chart i.e. sin/cos but now you claim that it is different. But it's true it may be different for example amplitude is different than generated by your KS package. Otherwise I can change it to daily bars and we will be compatibile....Than I will try to find this slow cycle manually and inform you about results.

Krzysztof
 
CSSA works intraday as well

Hi,

You said you use EOD NST. Than did you test your indcators on intraday data before release or real time ??

Why you assumed that they will work when most likely you never test them intraday because simply you don't have NSDT ??

Or maybe they are only for EOD data ?? It's nowhere written this. Can you tell something
about this ??

So what about those exact settings for EURUSD EOD for out of sample test ??

Krzysztof

Krzysztof,

CSSA v1.0 went though two years of qualification testing on EOD data before the release. It was 3 years ago. But since our users were mostly Intraday (CSSA handles all time granularities) we then went through an additional phase of Beta testing done by Forex traders exclusively. We also have added indicators (available in v1.1) based on their suggestions to specifically address the Forex market. Go to the Ward Systems Group forum for comments, tips and trading strategy examples Ward Systems Group Tech Support Site.

Read also my post#73 for some of the tips. If you don't have v1.1, please ask our support.

Most our trading intraday is done on MetaStock but we personally don't trade Forex. Only ETFs. But you can see by yourself real time results on this blog: Noxa Indicators. Charts are plotted on two time steps to show that the indicators do not repaint.

Noxa
 
Hi,

CSV files are in post 78

I believe you are making error here. Compare my setting and yours. Optimizer will
change the maximum of random numbers so we will have 100% hit, you didn't fixed it so
noise amplitude will not be 20 !!!

You didn't post trading rules like me which are different after optimization than input
values !!!!

Just rerun my chart and post results. It has data saved

Krzysztof

P.S. Out of couriosity. How long you are using NS ?? :p

That's true! In trying to reproduce your noise, I was letting the GA to tune it as well
. My mistake. So the noise was changing at each iteration.

In order to avoid any more mistakes I went ahead with your GOLD5.csv data file; I changed the date to make it compatible with our EOD version of NeuroShell and gave it a shot.

BTW you should use legacy compression to allow readers to unzip your files with old zip utilities... We had to upgrade WinZip today...

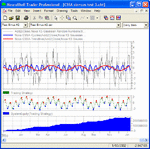
Your S/N = -18dB in GOLD5.csv (correct me if I am wrong) which is one order of magnitude more noise that the -6dB I was using. Fair enough but I had to enlarge the training ranges a bit to handle this noise: Lead = 0~1, Smoothing = 0~0.1. I have done only one quick test which I'll need to replicate with your other data files but the GA found a good solution right away with 100% profitable trades (see printshots attached).

The blue cycle corresponds to the long entry found by the GA
The red cycle corresponds to the short entry.

I'll get back with more testing results later. This is a holiday in Canada ON but I may go to the office and try with an earlier version of NeuroShell. I doubt this is the issue though.

Noxa
 

Attachments

  • zzzz5.gif
    zzzz5.gif
    15.2 KB · Views: 392
  • zzzz4.gif
    zzzz4.gif
    15.4 KB · Views: 451
  • zzzz3.gif
    zzzz3.gif
    15 KB · Views: 394
  • zzzz2.gif
    zzzz2.gif
    15.6 KB · Views: 756
  • zzzz1.gif
    zzzz1.gif
    23.7 KB · Views: 618
Gold5

That's true! In trying to reproduce your noise, I was letting the GA to tune it as well
. My mistake. So the noise was changing at each iteration.

In order to avoid any more mistakes I went ahead with your GOLD5.csv data file; I changed the date to make it compatible with our EOD version of NeuroShell and gave it a shot.

BTW you should use legacy compression to allow readers to unzip your files with old zip utilities... We had to upgrade WinZip today...

Your S/N = -18dB in GOLD5.csv (correct me if I am wrong) which is one order of magnitude more noise that the -6dB I was using. Fair enough but I had to enlarge the training ranges a bit to handle this noise: Lead = 0~1, Smoothing = 0~0.1. I have done only one quick test which I'll need to replicate with your other data files but the GA found a good solution right away with 100% profitable trades (see printshots attached).

The blue cycle corresponds to the long entry found by the GA
The red cycle corresponds to the short entry.

I'll get back with more testing results later. This is a holiday in Canada ON but I may go to the office and try with an earlier version of NeuroShell. I doubt this is the issue though.

Noxa

Hi,

I never measure GOLD5. I made it with the generator mixing gauss noise and sin-cos signal. Maybe better use example with multiplication of 2 random numbers that is easy to measure S-N ratio by modulating noise amplitude by changing maximum of random numbers.

I'm also very worried that I'm not able to recover slow cycle, i tried already last evening with eigevectorsshow tool, i will try once more this evening, can you tell the rule of setting m-history to proper value ?? Obviously you found this cycle very easy in post 95 using your KS package.

Krzysztof
 
A first glimpse at SSA eingenvectors

Hi,

I never measure GOLD5. I made it with the generator mixing gauss noise and sin-cos signal. Maybe better use example with multiplication of 2 random numbers that is easy to measure S-N ratio by modulating noise amplitude by changing maximum of random numbers.

I'm also very worried that I'm not able to recover slow cycle, i tried already last evening with eigevectorsshow tool, i will try once more this evening, can you tell the rule of setting m-history to proper value ?? Obviously you found this cycle very easy in post 95 using your KS package.

Krzysztof

Krzysztof,

From now on I won't try to duplicate your noise. I'll be only using the csv data you provide. Of course I'll be looking at your other files and will let you know how it goes.

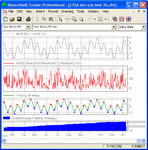
Further to my last post, here is a quick example on how you can use CSSA ShowEigenvector. I use GOLD5.csv.

I have attached a screen shot of your data with the cycles that CSSA inferred. I also have attached screen shots of the corresponding eigenvectors from ShowEigenvector; I have selected the green chooser to a width of one to select individual eigenvectors. As you can see GOLD5 has interesting structure in it which materializes in the form of a plateau in the singular spectrum. Plateaus are great in trading...

Eigenvector 1 = DC component. See brown overlay on price obtained with CSSA Trendline. In this example the DC component accounts for most of the variance; it has the highest eigenvalue.

Eigenvector 2 is the second strongest component in term of the variance. It is cyclic representing cycle shown top graph (blue cycle).

Eigenvector 3 has almost the same strength as eigenvector 2. The cycle is shown in green. As you can see it is almost identical to cycle 2 (same amplitude and phase) but is perpendicular in the embedding space; interesting data indeed.

Eigenvector 4 is the slow cycle you was looking for; see red cycle on graph.

In this case of data with a DC component, you have to use CSSA Cycles in order to find the slowest cycle since the first component (from Trendline) is now used to represesent the DC component. In the previous case of the data centered to 0 I had to use Trendline.

The other eigenvectors represent noise.

Hope this helps

Noxa
 

Attachments

  • zzzzz1.gif
    zzzzz1.gif
    23.2 KB · Views: 539
  • zzzzz2.gif
    zzzzz2.gif
    6.5 KB · Views: 371
  • zzzzz3.gif
    zzzzz3.gif
    6.7 KB · Views: 386
  • zzzzz4.gif
    zzzzz4.gif
    6.6 KB · Views: 376
  • zzzzz5.gif
    zzzzz5.gif
    6.3 KB · Views: 321
m-history

Thanks for eigenvector info.

Any tips about m-history setting. From my statistics from post 93-94 performance depends very much of it, however I'm not sure what GA set there in GroupStart/Depth and I couldn't come to any conclusion.

Bigger m-history ===> more eigenvectors ===> lower resolution I think and bigger chance to catch the noise.

Very good example is my GOLD15 sin-cos signal where is just 5 of eigenvectors them than a gap and noise but signal with noise has not so clear structure.

Is CSSA making a kind of Bartel test on eigenvector ? What is a criterium of grouping ??

So what was your procedure to find m history to recover slower cycle from post 95 ??

Krzysztof

m-histories sets the number of cycles. It also means the maximum period that can be resolved by CSSA. When trading Stocks or ETFs EOD I simply set it to 50 bars as I expect the maximum useful period to be one or two months of trading and forget about it. I might in some rare occasion allow the GA to refine it but I make sure that the ranges remain small. As for the Forex, use "time relevance" to set it as per my post#73.

I should say:
Bigger m-history ===> more eigenvectors ===> higher resolution as the cycles are more continuous when tuning GroupStart and GroupDepth. As you increment/decrement by one unit GroupStart or GroupDepth, the modification of the cycle is small. This feature is great as you can identify hills in the search space. There is a trade off between execution speed (slows quadratically with m-histories) and resolution.

>> lower resolution I think and bigger chance to catch the noise.
No! Higher resolution instead and yes larger m-histories means better capacity at catching fine grained noise but use GroupStart and GroupDepth to remove it.

>> Is CSSA making a kind of Bartel test on eigenvector ?
No it does not. It uses the eigenvalues which are a measure of the variance the cycles account for. It can also be interpreted as the significance of the cycles.

>> What is a criterium of grouping ??
You can imagine the grouping as a band pass window.
GroupStart low means lower cycles
GroupDepth = 1 means only one cycle. The higher GroupDepth, the more cycles in the reconstruction, the better the accuracy at reconstructing the signal but the higher the risk of overfitting. A general rule "Simple but not simpler" or the less cycles is generally better but don't coarse grain too much. The following tuples work well EOD:
(m-histories = 50, GroupStart = 9, GroupDepth = 4)
(m-histories = 50, GroupStart = 10, GroupDepth = 3)


>> So what was your procedure to find m history to recover slower cycle from post 95 ??
Simple: a few manual trials looking for a gradient or a smooth change towards the smallest ripple. I did not even use ShowEigenvector as I new that I had to use Trendline.

In your toy example it is very easy to identify well defined cycles with ShowEigenvector. This is not always true with real data. We mostly use ShowEigenvector to identify plateaus when developing indicators; we rarely use it on raw data

With ShowEigenvector:
- identify the slowest (smoother) component
- in CSSA Cycle, set the component accordingly
- try a few values manually following the gradient until you reduce the ripple to a minimum. When you are done, try other values separated from the value you found by half the period of what you expect. It should take you just a few minutes.

Noxa.
 
Thanks for this info, it is very valuable for a new users. Meanwhile I repeated the test on GOLD5 and also achieved very good hit - 80%. So for this level of noise NOXA outperformed MACD (30%) a lot !!! Than it confirms my statistic from post 94 that with high noise it performed well. Last result S=2.5, N=80 ==> -15db (calculation based on maks amplitude)

Any special reason that you don't want to repeat test using multiplication of random numbers ??? It's much easier than create the time series. Noise from GOLD5 is a gauss noise, multiplication of random numbers will not have a gauss distribution and will be more similar to market noise I think but I will check it ?

For curiosity. How did you measure S/N ratio of GOLD5. Just checking others .csv to find amplitude or you have a tool ??

Krzysztof
 
Top