Noxa indicators for Neuroshell

Noxa CSSA Setting

Hi all, i have a problem for best setting of Noxa CSSA:

For 15 mins EURUSD. What are the Best parameters for

Noxa CSSA-Long Entries #2 ( Close, x,x,x,x,x,x, x)
Noxa CSSA-Short Entries #2 ( Close, x,x,x,x,x,x, x)


?????????????????


Thank you for the help

Ones :)
 
Here is one of trading result sample using Noxa, the gray candles used for optimization, orange candles for paper trade and green for real trade. No optimization during the real trade.

One day trade simulation result: 1st trade= 50 pips, 2nd trade=42 pips, 3rd trade=75 pips, 4th trade =17 pips (open trade).

Arry
Keep learning ..and learning prior to success!!!

Hi,
very interesting,
I'm starting now with noxa but nothing of similar to yours….:confused:
 
Indicators are important measuring devices but It mostly comes down to the right trading strategy...

P.Z

Hi,
very interesting,
I'm starting now with noxa but nothing of similar to yours….:confused:
 
I am not sure m-histories = 20 is a wise choice on a 15mn time frame. m-histories = 20 means that you are measuring cycles with a period of 20 bars maximum which is 5 hours of trading. Any cycle of larger period will be discarded. One other potential problem is the poor resolution you can achieve making the exploitation of your system difficult. By resolution I mean the similarity of contiguous cycles as you adjust other parameters. You want your fitness landscape to be as smooth as possible. I would personally choose a larger value for m (m>100) and adjust the group range accordingly (GroupStart, GroupDepth) to get similar cycles. And you’ll improve smoothness too! Others prefer to fix the group and fine tune m-histories instead…

I don’t mean you won’t be able to get good results with m-histories = 20 but there is a good chance that your experts won’t be practical. Here is a sensitivity analysis I performed on one of my systems. I first used a DOE procedure (Design Of Experiment) to come up with most parameters (I use a delay line of several lagging and non lagging CSSA cycles on GM) and retained only the lag parameters for the GA to tune. (see graph attached). DOE is great to provide a good feeling for searching landscapes. As you can see in the graph, there are two spikes centered on bar# 1800 and 2300 respectively. You can get 65% yearly return with bar# = 1760 but this system is very brittle. As you adjust the bar# by one (which happens all the time during trading) you’ll loose it all. This system is not robust. You won’t be able to keep exploiting it as market conditions change. However the spike centered at bar# = 2300 is much smoother. There is a definite slope that gives good indication for the gradient descent. I don’t need to revamp my systems when they stop working. Just a little tweak of the parameter often suffices.

My 2 pips.

Lovroc

Hi All,

i stay work on ts €$ with cssa cycle and i used for 15M TF an m histories =20

What do you think? Try to applicate it and confirm if is good also for you.

Regards

Ones
www.consultingtrading.it - home page
 

Attachments

  • Sensitivity Analysis.gif
    Sensitivity Analysis.gif
    5.5 KB · Views: 829
Hi Chris,

I am a newbie to this forum but I happen to use the Noxa CSSA addon.

I found the indicators quite easy to understand and to handle (as in control). They are zero-lag indicators and do provide very accurate change points at any timescale!!! This is real as you can see in the chart example attached. But more surprising, I was able to identify cycles that persist and generalize very well out of sample!!! By the way the results attached are out of sample...

Truly impressive!!!

The best indicators for me so far.

P.Z

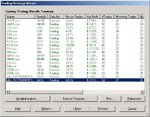
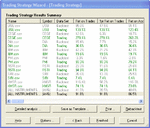
I recently started using Neuroshell and the CSSA indicators. I ran a test using the same data as in your example and the same settings for the long/short entries#0. One year of backtesting, one year trading, no optimisation.

The results are below. The back test period is mid 2006 - mid 2007. The trading period is mid 2007 to mid 2008.

In some cases the back test results are bad and the trading results are good so I am not sure of the robustness of this model. I am trying to filter these indicators to give a lower number of signals but get high probability turning points i.e peaks/valleys.

Any advice appreciated.

Thanks

M Ballagan
 

Attachments

  • results.JPG
    results.JPG
    61.3 KB · Views: 982
Last edited:
Backward backtesting

I used 2 years backtesting period. Pay also attention to the Training Range of the CSSA entries which might be different in your case too.

I mostly trade ETFs. For example I find cycles on the DIA and then backtest it on a basket of securities to get an idea of its robustness. Remember that the same cycle is being applied to all securities in the basket but there is no justification as to why such cycle should be profitable across the board. Cycles should be individually fine tuned to each security you trade.

Backtesting and assessing robustness is such an important and under emphasized topic. I am glad you bring that up. The common practice is to optimize on training data and hope it does not fall apart during later trading. I call it forward backtesting. To me this assumption is not justified. Why? Simply because causation is not correlation!!!! Sorry if I keep repeating myself but this is so crucial. An up-trending equity line indicates a good correlation between entries and price. There is no reason it should continue moving forward as it is most often a form of overfitting. What I personally do is look at backward backtesting instead. I optimize on the most recent data and then look how it generalizes on past data. At least, I am more likely to find more recent cycles with some causal logic attached to them.

P.

ps. I keep adjusting the same baskets to get a feel for market directions. See results attached…


I recently started using Neuroshell and the CSSA indicators. I ran a test using the same data as in your example and the same settings for the long/short entries#0. One year of backtesting, one year trading, no optimisation.

The results are below. The back test period is mid 2006 - mid 2007. The trading period is mid 2007 to mid 2008.

In some cases the back test results are bad and the trading results are good so I am not sure of the robustness of this model. I am trying to filter these indicators to give a lower number of signals but get high probability turning points i.e peaks/valleys.

Any advice appreciated.

Thanks

M Ballagan
 

Attachments

  • Basket DIA - Entries#0 - #7c.gif
    Basket DIA - Entries#0 - #7c.gif
    17.3 KB · Views: 951
I'm glad I found this thread.

I am interested in buying Neuroshell and the NOXA addons, but I'm a little weary of the price. I know NS offers a 30 day money-back guarantee, but I don't think I can discover everything there is to know in 30 days.

For those who have been successful with it, have you been able to develop profitable/robust systems on currency pairs? Specifically EUR/USD and GBP/USD. I'm interested in longer-term systems that place trades on the daily charts.

Also, I know Neuroshell Day Trader allows for tick, volume, and range bars. Do you find that you can create more profitable models if you are utilizing volume or tick bars rather than time based charts?

Any help would be greatly appreciated.
 
I find this thread to be very interesting.I was told that the beta version of the noxa cssa for beta testers could reframe ie the cycles may change after the fact. Now that there is the official release version, does this happens as well?

Thanks.
 
Combine Neuroshell with MT4

Hi Friends,

Sorry due to my absence for a while.

Here I would like to show you how I can combine the power of Neuroshell-Noxa with other traditional indicators especially for short-term trading (confluence).

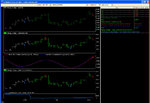
1. I made two strategy with Noxa (4H cahrt): built in #2 and cycle cross over, afterward I made hybrid combination for both (you can see on Neuroshell help to do this, I have several days to get there). Based on Neural network output, we are in Long mode (chart 1), this condition as original information that I should place long entries only.
2. I come to my MT4 chart (chart 2), I place long entry when my indicator in MT 4 confirm to buy. In this example: candle stick is on double bottom (on H1 or M15 chart) at Fibonacci pivot, my moving average cross over above (indicate by blue dot), stochastic cross above 20 and DI+ cross above DI-.
3. My exit long whenever my moving average cross below in 15M chart or if close go below the moving average.

Cheers,
Arry
 

Attachments

  • NS Hybrid 2 out of 2.jpg
    NS Hybrid 2 out of 2.jpg
    178.5 KB · Views: 1,223
  • MT4 chart buy dip.jpg
    MT4 chart buy dip.jpg
    271.9 KB · Views: 1,291
Let me clarify things here.

It was never the case (Beta or released versions). Cycles from Noxa-CSSA have always been static (i.e. they don't change when new data arrives). Indicators in the package do not use hindsight or forward-reference and signals can be traded at the close of each bar.

Somebody suggested that this package was a scam. You can read the post here:
Hindsight-based scam in progress - Traders' Consortium

To prove that it was not the case, we have posted a chart example untuned on purpose at different time steps to show that cycles do not change after the fact. See "Too good to be true?" post here:
Noxa Indicators: March 2008

Hope this helps.

Noxa


I find this thread to be very interesting.I was told that the beta version of the noxa cssa for beta testers could reframe ie the cycles may change after the fact. Now that there is the official release version, does this happens as well?

Thanks.
 
Finally Noxa owner come to this thread

Hi Noxa,

Welcome to this thread:clap:

I am very glad, finally noxa owner come to this thread. Hope your input how to use noxa correctly can prove how good noxa and nobody do mistake using noxa.

I bought noxa since march 08 and getting difficulties at the beginning due to the following:
- Less explanation how to use noxa to create trading strategy/prediction. The sample shown on help only the final result without explaining how it achieved (manually or by neuroshel optimization).
- I experienced it is not easy when we put into optimization in neuroshell especially for different data (forex in different time frames).
- Is there any advice how to put parameter indicator in optimization? currently I add parameter linkage in order we get the same value for Long/Short signals.

Thank you for your prompt explanation (y).
Arry
 
Hybrid signal update

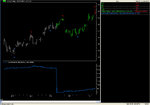
My trading strategy generate new Short signal about 3:50am (fxdd server time). I would like to see whether this signal is valid or not.

Other confluence reasons why put Sell entry (1H chart):
- Noxa generate sell entry.
- Bearish candlestick pattern (dark cloud formed)
- Candle leave from strong Resistance (Daily R3)
- moving average across below.
- stochastic cross below 80.
- ADX confirm correction (DI+ decrease, DI- increase, ADX decrease).

It may still a weak short signal due to daily chart still in uptrend, fundamental news (Bernanke testimony)upcoming may deteriorate technical analysis, but who knows.

Any advice are appreciated.

Cheers,
Arryex
 

Attachments

  • New update signal 10-Jul-08 4am (fxdd server).jpg
    New update signal 10-Jul-08 4am (fxdd server).jpg
    112.3 KB · Views: 888
  • MT4 chart sell 10-Jul-08 3.36am.jpg
    MT4 chart sell 10-Jul-08 3.36am.jpg
    265.5 KB · Views: 924
Last edited:
Optimizing CSSA?

Warning: We are strongly biased!
Our way to deal with the No Free Lunch theorem: “matching algorithms to problems gives higher average performance than does applying a fixed algorithm to all”. No free lunch in search and optimization - Wikipedia, the free encyclopedia


> currently I add parameter linkage in order we get the same value for Long/Short signals.

What’s your rationale here? To us, if thresholds are involved in generating signals they might be different for long entries as opposed to short entries.


> Less explanation how to use noxa to create trading strategy/prediction. The sample shown on help only the final result without explaining how it achieved (manually or by neuroshel optimization).

Don’t expect quick recipes from us. There is no such thing that can be taught. There is however tons of value in the examples we provide if you have the time to really understand them.

To answer your question, we don’t use the Genetic Algorithm (GA) as most traders do. We don’t let the GA set the parameters of the final system (your impression that parameters were manually set). Instead we use the GA to optimize our process of developing trading strategies so that the final result reflects the appropriateness of the entire decision making process.

A few quick notes:
- Optimizing final parameters is rather superficial as it does not examine the processing that led to it; it does not validate our understanding of the markets.

- Markets cannot be expressed with simple genomes; direct encodings do not cope well with complexity. As in nature, genes should not encode trading strategies but the developmental processes that led to them.

- CSSA cycles are more like features and patterns than the constant waves of Fourier or other cycle detection methods. As you’ll notice, there are usually just a few genuine cycles that are relevant to the instrument. Letting the GA finding them does not specify the form of the market features (here the cycles), but sets constraints on the parameters that might account for the market instead. But without well-chosen parameter ranges, all the number crunching will just memorize the training data.


Our recommendation is that you first use CSSA cycles without any NeuroShell auto-optimizations. It is already incredibly useful just to look at them. In fact, if you are an experienced trader, you can just couple them with resistance and support lines and you're ready for manual trading.

As you become more familiar with the cycles, identify a few of them that worked well in the past. These cycles will constitute the market features you are interested in; you can picture them as stationary market regimes you can choose from when appropriate. Merge them in a trading system which parameters can be tuned by looking at incremental improvements of the equity line. This way you are more likely to get a smooth searching landscape with gradients you can rely on to assess the robustness of your system.


> Is there any advice how to put parameter indicator in optimization?

Well, we still use the GA to search for cycles but as a tool to assess the instrument potential. A high occurrence of up trending equity lines for example is a good indication that we should keep investigating this instrument.

I hope he won't mind (or charge us) if we quote him at length; a fellow CSSA user gave his two pips on optimizing CSSA cycles:

“ A technique which I have touched on elsewhere is to keep GroupStart and GroupDepth constant, and to adjust m-Histories as relevant to time. For example, I treat 1 week as a 5-day x 5-day matrix, and these time-relevant settings seem to work well in currencies. I also find pulling in the ranges from multiple time-frames extremely useful (perhaps in your case, weekly and monthly).”

We personally keep m-Histories fixed and adjust GroupStart and GroupDepth to reflect the level of detail we are more comfortable with.

Here are a few additional tips:
- Set ranges as small as possible. The lead parameter for example could be limited to 0~1 as the cycles do not lag,
- Set ranges incrementally and sequentially to get a feel of the learning dynamics,
- As you set ranges, you should see results changing smoothly as you get away from the best setting,
- Pause the optimization each time you see an improvement in the return to avoid overfitting.


Hope this helps

Noxa


Hi Noxa,

Welcome to this thread:clap:

I am very glad, finally noxa owner come to this thread. Hope your input how to use noxa correctly can prove how good noxa and nobody do mistake using noxa.

I bought noxa since march 08 and getting difficulties at the beginning due to the following:
- Less explanation how to use noxa to create trading strategy/prediction. The sample shown on help only the final result without explaining how it achieved (manually or by neuroshel optimization).
- I experienced it is not easy when we put into optimization in neuroshell especially for different data (forex in different time frames).
- Is there any advice how to put parameter indicator in optimization? currently I add parameter linkage in order we get the same value for Long/Short signals.

Thank you for your prompt explanation (y).
Arry
 
Great Advice

Hi Noxa,

The reasons why I put linkage due to I directed my self by the example in the help file, here attached samples (Sorry to misunderstand the samples:cheesy:). I am in the middle between the purpose of using Neuroshell GA and Noxa.

To have advantage for noxa users, I wonder if you can put the additional guide(step by step) in the help how to set the noxa parameters (in the new revision maybe):idea:.

Thanks a lot for your advice.
Arryex
 

Attachments

  • Why 1.jpg
    Why 1.jpg
    76.3 KB · Views: 1,080
  • Why 2.jpg
    Why 2.jpg
    77.6 KB · Views: 956
  • Why 3.jpg
    Why 3.jpg
    72.7 KB · Views: 803
  • Why 4.jpg
    Why 4.jpg
    68.9 KB · Views: 811
Arry,

None of the chart examples you cited above involve thresholds; these examples were given to illustrate the use of built in signals triggered from turning points or zero line crossings. Rules to go long and short were set identically in these examples for the sake of simplicity.

In the section dedicated to trading strategies though, you’ll notice that signals to go long or short have their own rules as per my last post.

Noxa

Hi Noxa,

The reasons why I put linkage due to I directed my self by the example in the help file, here attached samples (Sorry to misunderstand the samples:cheesy:). I am in the middle between the purpose of using Neuroshell GA and Noxa.

To have advantage for noxa users, I wonder if you can put the additional guide(step by step) in the help how to set the noxa parameters (in the new revision maybe):idea:.

Thanks a lot for your advice.
Arryex
 
CSSA FlatLines - Call for Beta testers

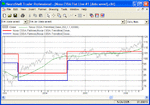
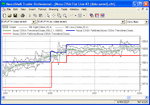
We all know that sideways coils are prone to fakeouts and that escaping a position against a breakout can be very expensive. Breaking out or down out of a congestive range is one of the big unsolved problems in daytrading.

We developed Flatlines to actually identify congestive ranges. It consists of an upper and lower line, demarcating the range boundaries. You can use price entry into the range as an exit, and price exit of either the upper line or lower line from within the range as an entry. The conditions can be adjusted by percentage or Fib percentage for that matter, plus a couple more methods of range adjustment.

Flatlines is an addition to the Noxa CSSA package. If you are interested, drop us an email. We’ll be happy to send you the upgrade.

Noxa
Noxa Analytics Inc :: Your Predictive Edge
 

Attachments

  • FlatLines #1.gif
    FlatLines #1.gif
    22 KB · Views: 1,789
  • FlatLines #2.gif
    FlatLines #2.gif
    24 KB · Views: 2,045
Christophe,

If you read this post, please confirm that you received the download link as requested. I know that you have trouble getting emails from us.

Thanks.

Noxa
 
Looking for a strategy that really works

Hi Noxa !

I'm looking for a strategy with NOXA that really works on forex EURUSD 15MN...

I trade on Metatrader4...

Could you please post a simple tutorial for newbies to put this on NSDT ?

...
 
Goldswinger,

Just out of curiosity: did you happen to use Noxa CSSA or Noxa NEI with NeuroShell Trader? Recall that we don't support Metatrader4 with these sets.

Noxa

Hi Noxa !

I'm looking for a strategy with NOXA that really works on forex EURUSD 15MN...

I trade on Metatrader4...

Could you please post a simple tutorial for newbies to put this on NSDT ?

...
 
Noxa CSSA Flatlines as an on/of switch

I guess I left you speechless with my last post ;-). Here is one tip on using CSSA Flatlines as an on/of switch.

CSSA Flatlines (available in Noxa CSSA v1.1 Beta4.0.3) consists of an upper and lower line, demarcating the + and – thresholds of a congestion range within which you may not want to take any trades. You can use price entry into this range as an off switch so you can get out in time and price exit of either the upper line or lower line from within the range as an on switch to anticipate a breakout. Entries can then be a simple crossover of a shorter m-Histories cycle with a longer one.

BTW, this model is very profitable!

Happy trading.

Noxa
Noxa Analytics Inc :: Your Predictive Edge

Hi Noxa !

I'm looking for a strategy with NOXA that really works on forex EURUSD 15MN...

I trade on Metatrader4...

Could you please post a simple tutorial for newbies to put this on NSDT ?

...
 
Top