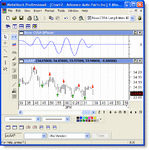
Noxa indicators for Neuroshell

Each of us certainly has his own very personal approach with trading. Here are a few general principles that I learned with NeuroShell over the years and happen to work very well for me.

1. Don’t measure the market but be the market. Obvious patterns are washed out almost instantly. Pretty much only the faint patterns resist market efficiency; only the faint patterns are left over for us to be exploited. Trying to measure them has detrimental effects. For example taking a moving average introduces a lag; any indicator for that matter induces some sort of distortion making it almost impossible to find genuine patterns. It makes sense after all; the Heisenberg uncertainty principle also applies to markets.

2. Try to make non-stationary inputs stationary; non-stationarities in markets cannot be exploited. Think of a system that would be fully adaptive: you would not be able to do better that just looking at price. NeuroShell however gives a static picture of markets meaning that it is possible to generate equity with it by picking stationary patterns (something that lasts); unfortunately these patterns are quite rare so why not inferring them? That also includes selecting carefully the data on which to optimize the system.

3. Think in terms of the cause not the effect. Patterns are the effects; our main mistake in trading is to look for correlations. For example we try to get uptrending equity lines in-sample assuming that they will stay strong out-of-sample. This is mostly relying on the correlation of the pattern we try to reveal though indicators and the price. This assumption is simply wrong. Causation is not correlation. Did you ever wonder why lags work sometimes? Simple explanation: the cause occurs before the effect.

4. Avoid spurious causation by manipulations. The best systems are those which resist to data manipulations…


Patrick
 
There is a good algorithm in CSSA Cycles. However, I believe it is Regression Slope of Moving Average, I believe same lag can be achieved with Jurik Research algorithm if not even less. Correct me if I'm wrong..
 
I don't think CSSA is based on calculating the slope of a moving average. As a matter of fact the cycles do not lag so it can't be. I know for sure that they extract cycle components from the variance in the data then CSSA allows the reconstruction of market cycles from a selection of these components. Their approach is quite different than having an MA-based tracker that has to lag somehow.

P.Z
 
Using EigenVectors

Currently I am evaluating the EigenVectors indicator in Noxa. It is used to define the GroupStart and GroupDepth for some Noxa indicators parameters used in Trading Strategy.

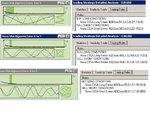
Some Lissajous pattern formed differently when shifting the Eigenvectors. Anybody can advice which Lissajous pattern should be selected to provide good trading strategy?

Here samples of Lissajous pattern formed at different GroupStart and GroupDepth values and the respective trading result, the chart with data is inserted on zip file.

On the help it mentioned "The corresponding Lissajous pattern is a circle. Their inherent persistence over time makes them especially worthy of attention." But to get the circle pattern is not easy.

Cheers,
Arry
 

Attachments

  • Compare eigenvectors.JPG
    Compare eigenvectors.JPG
    72.3 KB · Views: 1,496
  • traderesult.JPG
    traderesult.JPG
    230.5 KB · Views: 1,704
  • Different eigenvetors with 1-1 opt-rl.zip
    26.4 KB · Views: 955
Hello Arry,

I had trouble using the Eigenvectors too. In fact they dumped it from the Beta version that I am testing for MetaStock.
Anyway I found the eigenvectors more useful on indicators rather than on price; any indicator for that matter. I look more precisely for a plateau in the spectrum (the wider and the flatter the best) where several pairs of eigenvectors plot a circular Lissajous. The eigenvectors in a pair appear shifted indicating a prediction mode…

Ps. Your optimization came out with about only 100 bars for the training range and a m-histories of 50. I don’t know much about Forex but your eigenvectors look pretty noisy; I wonder whether you can get anything good from this model. I would have expected something like m-histories = 250 or more with a training range at least four times that!

My two cents.

P.Z


Currently I am evaluating the EigenVectors indicator in Noxa. It is used to define the GroupStart and GroupDepth for some Noxa indicators parameters used in Trading Strategy.

Some Lissajous pattern formed differently when shifting the Eigenvectors. Anybody can advice which Lissajous pattern should be selected to provide good trading strategy?

Here samples of Lissajous pattern formed at different GroupStart and GroupDepth values and the respective trading result, the chart with data is inserted on zip file.

On the help it mentioned "The corresponding Lissajous pattern is a circle. Their inherent persistence over time makes them especially worthy of attention." But to get the circle pattern is not easy.

Cheers,
Arry
 

Attachments

  • EVectors DIA EOD 2.gif
    EVectors DIA EOD 2.gif
    9.1 KB · Views: 1,064
  • EVectors DIA EOD 1.gif
    EVectors DIA EOD 1.gif
    9.1 KB · Views: 1,146
  • EVector.gif
    EVector.gif
    2.7 KB · Views: 1,085
  • DIA EOD.gif
    DIA EOD.gif
    21.7 KB · Views: 1,281
I could write a thesis predicting cycles!

I got very mitigated results trying to predict CSSA and even cycles using NeuroShell. I think that FeedForward neural nets cannot deal well with temporal sequences. I did not give up and developed my own models with some encouraging results but I was barely able to predict more than one full period ahead. However I got some very good results when trying to predict SSA with CSSA as inputs with a memory-based recurrent state space model. Now my predictions go beyond 6 periods with good accuracy of the turning points! There is something very interesting to learn from the CSSA/SSA relationship!

P.Z
 
Nice idea, will have to try it out. I had no success predicting SSA before. However, I tried to predict MA Momentum feeding Fourier harmonics as inputs. Basically I was trying to find harmonics presented for some period of time in the market. It appeared to be good at training data and not so promising on out of sample data. Did you try to feed correlation along with inputs? Also, what software did you use? Or is it self-made?
 
Last edited:
Hi Sedkol,

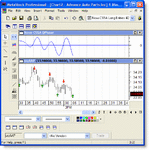
I have attached my first good results of SSA prediction for you to see. The prediction starts at bar# 2450. The objective is to predict the next 50 bars as they are missing in the original SSA (m-histories=50).

Yes the software is mine. Just to give you a hint, I first use a Genetic Programming and some artificial embryogeny to grow a state space machine from the in-sample data. Then I train my machine using several rules inspired from biology. Finally I let the machine generate the cycle by itself. This is that simple '-)

As for using correlation? I tried but unfortunately my results were not very robust. I extensively use the cointegration metric form Granger though: http://repositories.cdlib.org/cgi/viewcontent.cgi?article=1019&context=ucsdecon

Remember correlation is not causation!

P.Z

Nice idea, will have to try it out. I had no success predicting SSA before. However, I tried to predict MA Momentum feeding Fourier harmonics as inputs. Basically I was trying to find harmonics presented for some period of time in the market. It appeared to be good at training data and not so promising on out of sample data. Did you try to feed correlation along with inputs? Also, what software did you use? Or is it self-made?
 

Attachments

  • SSA cycle prediction.gif
    SSA cycle prediction.gif
    9.8 KB · Views: 1,376
From what I can see, P.Z, you had quiet stunning results predicting SSA in terms of causation. Keep up the great posts, I am more and more into that thing and really think your posts are very helpful.
 
Sedkol,

I found trading excessively competitive; there is no such thing as a software that will make you happy by casually clicking on green and red arrows with a smile on your face. I bet the lifetime of traders is less than a few months for most of us because the (scam?) trading industry sell us dreams. This is hard work to develop strong principles that work. But I found the guys at Ward Systems and Noxa very inspiring and now that it started paying off I thought I should give back some of what I learned the last 15 years...

P.Z

From what I can see, P.Z, you had quiet stunning results predicting SSA in terms of causation. Keep up the great posts, I am more and more into that thing and really think your posts are very helpful.
 
P.Z,

I think we could go on and on discussing that topic. I do agree that trading is very competitive. I believe the one most important thing is discipline. Another most important thing is not to stop learning. Never. It can take a lifetime to master. It is just my opinion and everyone, I believe, sees it in its own perspective. Wards, Noxas products, for example, helps to make your own way in learning process. There will never be a holy grail software, I completely agree with you.
 
I think better we share tips using Noxas Cycles in this thread. Talking about correlation on another topic came to some ideas. As we can assume there maybe different cycles in different time scales in the market. Probably we could measure a correlation between cycles and price, if a correlation is more then some threshold then buy/sell signal. Or we could measure what cycles has more correlation with price then others and work on them. Haven't come to a conclusion how to automate it yet and haven't tested it fully either, but I do think the idea is worth a try. Any suggestions?
 
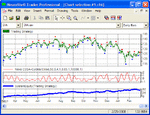
There are instruments that have very resilient cycles. For example I extensively use the tuple (m-histories = 50, GroupStart = 9, GroupdDepth = 4, Lead = 1, Smoothing = 0.05) on the DIA EOD. It works also on stocks and intraday. See the 1min charts on AAP from yesterday. When the cycle deviates from the data, meaning that the market entered a different regime, I get out and quickly adjust the parameters. It does not take long as I keep track of cycles that worked in the past.

When you start investigating a new instrument, you can use this trick to have an idea of its potential: feed a neural net with a couple SSA inputs (not CSSA but SSA) and train it. Given that you get a strong equity line out-of-sample, look at the parameters. If they make sense, write them down and start tuning them from here in your CSSA cycles.

You can also feed a neural net with lagged CSSA cycles this time (up to 5). Retain the most robust cycles for your future trading. You can also use this neural net to trade.

P.Z


I think better we share tips using Noxas Cycles in this thread. Talking about correlation on another topic came to some ideas. As we can assume there maybe different cycles in different time scales in the market. Probably we could measure a correlation between cycles and price, if a correlation is more then some threshold then buy/sell signal. Or we could measure what cycles has more correlation with price then others and work on them. Haven't come to a conclusion how to automate it yet and haven't tested it fully either, but I do think the idea is worth a try. Any suggestions?
 

Attachments

  • AAP 1min March 27 08 #1.gif
    AAP 1min March 27 08 #1.gif
    28.3 KB · Views: 1,138
  • AAP 1min March 27 08 #5.gif
    AAP 1min March 27 08 #5.gif
    28.5 KB · Views: 1,005
Friends,
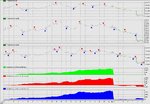
Here are my update, after insisting to learn more detail about noxa, I created about 5 trading strategy respectively using Qphase, Cycle, Oscillator, Built in signal, S/R violation and one special combination:D.

Applied in Forex market (mini account), EURUSD 15m, Trading strategy rules (as mentioned on noxa help), trading: as many as possible with $500 initial account, Dates: opt 5 days & paper trade in last 2 days, Cost: $2 per trade entry/exit for spread & $100 margin, optimization criteria: Maximize (win - loss)*profit.

Here you can see below the chart for all trading strategy and the system equity for each.

Happy trading...
Arry
"Keep Learning..and learning prior to success...."

Hi Arryex,

What are the Parameter values for the 5 strategies or indicators. Did you just optimize them to get the Values or did you have some indicators manually unoptimized. Any advice will be appreciated. if you can post them that would be great.

For Example.

For 15 mins EURUSD. What are the Best parameters for

Noxa CSSA-Long Entries #2 ( Close, x,x,x,x,x,x, x)
Noxa CSSA-Short Entries #2 ( Close, x,x,x,x,x,x, x)

How do find them? using trading strategy Optimization or by manually by visually trying to eyeball the Parameters?

What is the parameters for NOXA CSSA Long-Short trading strategy for EURUSD 15 mins. If you can paste it her that would great. I am trying to Learn NOXA CSSA and Neuroshell Daytrader Professional 5.4 . I have created a couple of sample trial strategies that i would like to know how to optimize the indicators / Strategies to get the best results. Snapshots would be great . I know how to optimize strategies in neuroshell what i would like to know is mostly about how to Optimize the Parameters for NOXA CSSA indicators and Strategies for FOREX especially EURUSD and GBPUSD ( 5 mins, 15 mins, 30 mins, 1 hour =====INTRADAY TIMEFRAMES )


Progressa
 
Last edited:
Setting Indicator parameters

Hi Progressa,

Sorry for the delay on responding, I am struggle to fight virus/spam on my PC.

Currently I am still learning how to set the parameter's for Noxa indicator,everybody may have own optimization style.

I found that the main things we need to understand first is the relation between Cycle/Qhase/Built-in indicators with EigenVectors and ShowRange, at least we should know what the objective using them. For example, to find the Eigenvector value in order the graph shown noise less (single mode display) or nearest Lissajous circle (dual mode display), effect of increasing groupdepth causing shorter cycle which generate more long/short signals.

Eigenvectors is used to set up the GroupStart and GroupDepth while ShowRange to setup the training range for optimization. By using correct set for them than you can either manual verification or run NSDT to find the optimal setting.

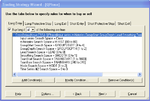
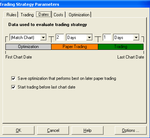
Here I put the sample how I put the parameters used for optimization for QPhase, I used CrossBelow for Long entry and CrossAbove for short entry (you should find why not in reverse!). On Trading Strategy parameter I use parameter search or full optimization, initial account $500 (you can set as you wish), I use 1 day for real trade as you can see Dates parameter setting (it shall be matched with ShowRange values for TrainingStart and TrainingBars), for the cost I use $2 per trade margin $100 and point value 10,000 for EUR USD (this applicable for mini account type).

I use them for any time frame and choose which one more benefit.

Hope it can fulfill your query, at least can guide you.

Good luck,
Arry
 

Attachments

  • Sample setup optimization parameter1.png
    Sample setup optimization parameter1.png
    16.7 KB · Views: 1,171
  • trading strategy dates setup.png
    trading strategy dates setup.png
    8.1 KB · Views: 1,193
Hi Progressa,

Sorry for the delay on responding, I am struggle to fight virus/spam on my PC.

Currently I am still learning how to set the parameter's for Noxa indicator,everybody may have own optimization style.

I found that the main things we need to understand first is the relation between Cycle/Qhase/Built-in indicators with EigenVectors and ShowRange, at least we should know what the objective using them. For example, to find the Eigenvector value in order the graph shown noise less (single mode display) or nearest Lissajous circle (dual mode display), effect of increasing groupdepth causing shorter cycle which generate more long/short signals.

Eigenvectors is used to set up the GroupStart and GroupDepth while ShowRange to setup the training range for optimization. By using correct set for them than you can either manual verification or run NSDT to find the optimal setting.

Here I put the sample how I put the parameters used for optimization for QPhase, I used CrossBelow for Long entry and CrossAbove for short entry (you should find why not in reverse!). On Trading Strategy parameter I use parameter search or full optimization, initial account $500 (you can set as you wish), I use 1 day for real trade as you can see Dates parameter setting (it shall be matched with ShowRange values for TrainingStart and TrainingBars), for the cost I use $2 per trade margin $100 and point value 10,000 for EUR USD (this applicable for mini account type).

I use them for any time frame and choose which one more benefit.

Hope it can fulfill your query, at least can guide you.

Good luck,
Arry

Hi Arry,

I found out that the indicators Qphase and Cycles depend on and mostly affected by the values of:

m-histories
Groupstart
GroupDepth

Once you determine the Range.

If someone can optimize the values of those indicators it is possible to create a very good trading system from them.
 
A note about the new Noxa CSSA indicators

A note about the new Noxa CSSA indicators. I've been experimenting with them and so far they are quite interesting. I've been able to run some simple charts and the initial runs show a significant improvement over my current systems. The other indication I find alluring, is that my nets seem to like them, as they get included in many of the nets I'm trying to train. This further suggests to me that they are adding something useful.

Anyway, they're certainly worth the entry price.

Lovroc
 
Top