Noxa indicators for Neuroshell

  • Thread starter Thread starter val2004
  • Start date Start date
  • Watchers Watchers 71
The adaptivity fallacy

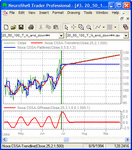
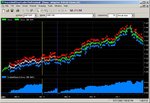
lag does not depend of m-mistory ??? Strange, see screenshot below. The same signal,
two CSSA cycles one with m-history 50 another with 250. It's clear that 250 has bigger lag i.e. time when cycles will disapear from indicator output after disappearing from the signal.

For the readers. After change the signal, the proper output is a flat line of course but this output is delayed due to lag.

Krzysztof


You are looking at the transition from one market regime to another one. I would not call it a lag. I would call it persistence.
Persistence = “Continuance of an effect after the cause is removed”

Whereas the term lag applies more to stationary regimes.


>> lag does not depend of m-mistory ???

This is not what I said!!!! I said the lag depends on the reconstruction; it depends on the group you choose. Ultimately if you use 250 components in your group for a full reconstruction, the lag becomes zero. You increased m-histories but you intentionally let the group unchanged making the reconstruction coarser.


Let me now state the obvious right up front:
Most indicators on Earth, (adaptive, non adaptive, oscillators, trendlines) have some persistence as long as there are not computed from thin air!!

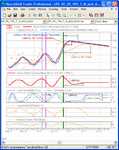
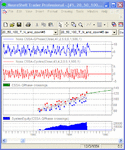
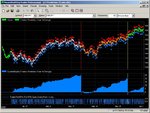
As you can see in the left chart below, the MESA Sinewave indicator fails in exploiting the cycles where CSSA succeeds.

The right chart shows the following:
- The “zero-lag” Instantaneous trendline trails the CSSA cycle by 3 to 4 bars,
- Crossings from MESA Sinwave lag the CSSA cycle by the same amount,
- An adaptive indicator such as Chande’s Vidya can have large persistence,
- The Sinwave persistence appears to be the worst in this small panel.


These results prove you wrong again!!!! You wrote in your post #246:
http://www.trade2win.com/boards/757594-post246.html
>> I found another strong weakness - lack of addaptiveness which I believe was
>> recognized by traders.
>> “So as a summary of those 2 posts we can say that CSSA has a big lag in case of
>> signal change plus will not adapt to not included in training range patterns.”

Instead these results indicate that CSSA-Cycle has no lag, and even if it does not adapt to features not learned, it behaves better than an adaptive indicator to a change in market conditions. It also behaves better that MESA Sinwave!

By stating that CSSA lacks adaptiveness (your post #250, http://www.trade2win.com/boards/757946-post250.html), you imply that adaptiveness is good. Your argument is a fallacy and here is why: adaptive indicators forget as fast as they can to adapt to new features therefore each feature becomes a new feature to them hence they carry a persistence moving forward. CSSA works because, by setting a training range, the user can select the whole data or any part of it to learn from the features he is interested in trading; the cycles can then be set so as to adapt to these features better than any other indicator with no learning capacity.

Noxa
 

Attachments

  • 20-50-100-T-N and down #6b.gif
    20-50-100-T-N and down #6b.gif
    25.2 KB · Views: 623
  • 20-50-100-T-N and down #6.gif
    20-50-100-T-N and down #6.gif
    30.1 KB · Views: 547
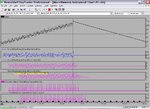
Let's put it in this way. The problem is clearly shown in post 242 and 265 CSSA generates orders against the trend either in case of E0 and QPhase indicators.

If CSSA picks the cycles from simple down line and on base of this generate those orders it means it's is simple oversensitive, it should generate just one sell order immediatelly after change to trend mode and hold the position.

I gave the Ehlers sinwave oscillator as an example how indicator should act in case of switch from trend with cycles to pure trend. My statement 'resistance' was that sine and leadsine will not cross in case of switch to trend mode so false signals will not be generated.

So lets wait for your settings which will recognise cycles from the left part of the chart
properly and don't generate false signals after switch to trend mode. Hopefully those settings will be generic i.e. they will still work in case of change for example slope of this line.

Personally I think that we deal with 2 problems here lag and oversensivity.

FYI, cycles at the left side are 20/50 and 100 bars period.

Krzysztof


You said:
>> I gave the Ehlers sinwave oscillator as an example how indicator should act in case of switch from trend with cycles to pure trend. My statement 'resistance' was that sine and leadsine will not cross in case of switch to trend mode so false signals will not be generated.

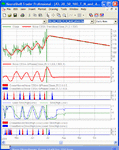
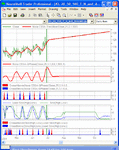
Well, the MESA Sine and Leadsine do cross apparently and quite badly (see bottom charts below). Another example of misleading statement!!!!

You also said:
>> If CSSA picks the cycles from simple down line and on base of this generate those orders it means it's is simple oversensitive, it should generate just one sell order immediatelly after change to trend mode and hold the position.

Your statement is not correct. In the case of a down trend, and because the last true signal is a sell signal, a cycle-based indicator should generate not only one false signal but two (buy + sell) to avoid being stuck in the wrong side of the trend. If the last true signal were going to be a buy, then only one false sell signal would be needed. In the case of an up trend however, the opposite would be true. In other words, for a cycle-based indicator to successfully detect a change in trend as shown in your example, it would need to craft its persistence response taking into account the last true signal and knowing the future. Since it does not know the future, it can’t.

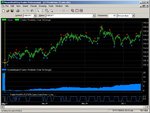
As you can see in the chart on the left, both MESA Sinewave and CSSA fail in detecting the down trend. Based on what I just said, it was very much expected.

As you can see in the case of an up trend (middle chart), CSSA does not generate false signals (which would be ideal) whereas MESA does (Thanks to your artificial signal). Even though CSSA does not make any mistake (which is certainly due to pure luck) it can be correct only 50% of the time about the direction of the trend as it does not know the future.


To wrap up on this, it is very unlikely that you will ever be able to successfully detect the trend in your example solely based on cycle-based indicators adaptive or not. There are other ways fortunately. I suggest that you experiment testing the validity of your signals based on CSSA Flatlines among other things (see chart on the right).

Noxa
 

Attachments

  • 20-50-100-T-N and down #7.gif
    20-50-100-T-N and down #7.gif
    30 KB · Views: 444
  • 20-50-100-T-N and down #7b.gif
    20-50-100-T-N and down #7b.gif
    29.4 KB · Views: 390
  • 20-50-100-T-N and down #7c.gif
    20-50-100-T-N and down #7c.gif
    20.7 KB · Views: 404
You are looking at the transition from one market regime to another one. I would not call it a lag. I would call it persistence.
Persistence = “Continuance of an effect after the cause is removed”

Whereas the term lag applies more to stationary regimes.


>> lag does not depend of m-mistory ???

This is not what I said!!!! I said the lag depends on the reconstruction; it depends on the group you choose. Ultimately if you use 250 components in your group for a full reconstruction, the lag becomes zero. You increased m-histories but you intentionally let the group unchanged making the reconstruction coarser.


Let me now state the obvious right up front:
Most indicators on Earth, (adaptive, non adaptive, oscillators, trendlines) have some persistence as long as there are not computed from thin air!!

As you can see in the left chart below, the MESA Sinewave indicator fails in exploiting the cycles where CSSA succeeds.

The right chart shows the following:
- The “zero-lag” Instantaneous trendline trails the CSSA cycle by 3 to 4 bars,
- Crossings from MESA Sinwave lag the CSSA cycle by the same amount,
- An adaptive indicator such as Chande’s Vidya can have large persistence,
- The Sinwave persistence appears to be the worst in this small panel.


These results prove you wrong again!!!! You wrote in your post #246:
http://www.trade2win.com/boards/757594-post246.html
>> I found another strong weakness - lack of addaptiveness which I believe was
>> recognized by traders.
>> “So as a summary of those 2 posts we can say that CSSA has a big lag in case of
>> signal change plus will not adapt to not included in training range patterns.”

Instead these results indicate that CSSA-Cycle has no lag, and even if it does not adapt to features not learned, it behaves better than an adaptive indicator to a change in market conditions. It also behaves better that MESA Sinwave!

By stating that CSSA lacks adaptiveness (your post #250, http://www.trade2win.com/boards/757946-post250.html), you imply that adaptiveness is good. Your argument is a fallacy and here is why: adaptive indicators forget as fast as they can to adapt to new features therefore each feature becomes a new feature to them hence they carry a persistence moving forward. CSSA works because, by setting a training range, the user can select the whole data or any part of it to learn from the features he is interested in trading; the cycles can then be set so as to adapt to these features better than any other indicator with no learning capacity.

Noxa
Please don't confuse the readers that you are comparing CSSA to MESA sinwave because it is not a case here. You are comparing CSSA to Hilbert sinwave in it's earilest version from 2000. This is Sine/Lead Sine indicator. It's well known that sinwave based on Hilbert transform are noise sensitive. I doubt that you didnt know about it.

MESA8 Add-On Help File

MESA sinwave is called Sine/SineLead and has 2 parameters

Regarding naming lag or persistence. It must be your naming, first time i hear this.
See link you have similar situation uptrend changed to down trend but lag is called lag

On Lag, Signal Processing, And The Hilbert Transform - March 2000

Anyway whatever it is called this trait is undesirable, it is simple delay of info about signal change. I changed the m-mistory to show this without changing the group because there was no change in contents of the signal so no change in significiant eigenvectors.

CSSA works because, by setting a training range, the user can select the whole data or any part of it to learn from the features he is interested in trading; the cycles can then be set so as to adapt to these features better than any other indicator with no learning capacity.

That's true and this is a problem because there is no guarantee than the pattern learned from training range will occur in the future.

It is a reason than for out of sample test for market signal, performance of CSSA and GA optimized MACD was similar as they follow the same philosophy of fixed settings.

Krzysztof
 
hiding problem

You said:
>> I gave the Ehlers sinwave oscillator as an example how indicator should act in case of switch from trend with cycles to pure trend. My statement 'resistance' was that sine and leadsine will not cross in case of switch to trend mode so false signals will not be generated.

Well, the MESA Sine and Leadsine do cross apparently and quite badly (see bottom charts below). Another example of misleading statement!!!!

You also said:
>> If CSSA picks the cycles from simple down line and on base of this generate those orders it means it's is simple oversensitive, it should generate just one sell order immediatelly after change to trend mode and hold the position.

Your statement is not correct. In the case of a down trend, and because the last true signal is a sell signal, a cycle-based indicator should generate not only one false signal but two (buy + sell) to avoid being stuck in the wrong side of the trend. If the last true signal were going to be a buy, then only one false sell signal would be needed. In the case of an up trend however, the opposite would be true. In other words, for a cycle-based indicator to successfully detect a change in trend as shown in your example, it would need to craft its persistence response taking into account the last true signal and knowing the future. Since it does not know the future, it can’t.

As you can see in the chart on the left, both MESA Sinewave and CSSA fail in detecting the down trend. Based on what I just said, it was very much expected.

As you can see in the case of an up trend (middle chart), CSSA does not generate false signals (which would be ideal) whereas MESA does (Thanks to your artificial signal). Even though CSSA does not make any mistake (which is certainly due to pure luck) it can be correct only 50% of the time about the direction of the trend as it does not know the future.


To wrap up on this, it is very unlikely that you will ever be able to successfully detect the trend in your example solely based on cycle-based indicators adaptive or not. There are other ways fortunately. I suggest that you experiment testing the validity of your signals based on CSSA Flatlines among other things (see chart on the right).

Noxa

I think you are trying to hide the problem here. By setting incorrectly m-history to 25 you are trying to decrease the lag. Correct setting to resolve cycles 20/50/100 is minimum 100, to resolve long forex cycles is minimum 200. Than there is a lot of false QPhase orders against the trend. See screen shoot.

So no exact settings to resolve this problem ?? Is is fixable ??

Krzysztof
 

Attachments

  • gg.JPG
    gg.JPG
    139 KB · Views: 564
Required further development (Adaptive CSSA)

As far as using noxa CSSA, I found the following:

- Hard to get circle Lissajous pattern especially based on Close value, using averaging get better. No specific way to get this lissajous pattern except by manual shifting.
- Using noxa CSSA, seems we left out the neural network on NSDT, why ? because identifying cycle is done manually (without automatic optimization).
- As long as the current market cycles are in line with identified cycle, you may get profit. But you will lost in case the market cycle changes its frequency.
- Noxa indicator is not adaptive, only identify unique cycle (certain frequency) for certain period and it will not change in case market cycle change it frequency.

I think I really need an Adaptive noxa cycle..Noxa please advice.

Cheers,
Arry
 
Wraping up on the

Please don't confuse the readers that you are comparing CSSA to MESA sinwave because it is not a case here. You are comparing CSSA to Hilbert sinwave in it's earilest version from 2000. This is Sine/Lead Sine indicator. It's well known that sinwave based on Hilbert transform are noise sensitive. I doubt that you didnt know about it.

MESA8 Add-On Help File

MESA sinwave is called Sine/SineLead and has 2 parameters

Regarding naming lag or persistence. It must be your naming, first time i hear this.
See link you have similar situation uptrend changed to down trend but lag is called lag

On Lag, Signal Processing, And The Hilbert Transform - March 2000

Anyway whatever it is called this trait is undesirable, it is simple delay of info about signal change. I changed the m-mistory to show this without changing the group because there was no change in contents of the signal so no change in significiant eigenvectors.


That's true and this is a problem because there is no guarantee than the pattern learned from training range will occur in the future.

It is a reason than for out of sample test for market signal, performance of CSSA and GA optimized MACD was similar as they follow the same philosophy of fixed settings.

Krzysztof


>> Regarding naming lag or persistence. It must be your naming, first time i hear this.
Now you know about persistence.


>> That's true and this is a problem because there is no guarantee than the pattern learned from training range will occur in the future.
I agree! But isn’t that obvious that we all don’t know the future? So this problem is even worse for indicators (adaptive or not) with no learning capacity.


Let me wrap up on the “Only one known to ‘you’ oscillator” issue before moving on:

You wrote in your post #276: http://www.trade2win.com/boards/771856-post276.html
>> I gave the Ehlers sinwave oscillator as an example how indicator should act in case of
>> switch from trend with cycles to pure trend. My statement 'resistance' was that sine
>> and leadsine will not cross in case of switch to trend mode so false signals will not be
>> generated.
>>So lets wait for your settings which will recognise cycles from the left part of the chart
>> properly and don't generate false signals after switch to trend mode

It appears that the Ehlers sinwave indicator badly failed in recognizing the cycles and not generating false signals as you stated which I have shown is impossible to achieve. Do you agree that your choice of the Ehlers sinwave indicator was completely irrelevant?

Noxa
 
Little or no faith in adaptive indicators

As far as using noxa CSSA, I found the following:

- Hard to get circle Lissajous pattern especially based on Close value, using averaging get better. No specific way to get this lissajous pattern except by manual shifting.
- Using noxa CSSA, seems we left out the neural network on NSDT, why ? because identifying cycle is done manually (without automatic optimization).
- As long as the current market cycles are in line with identified cycle, you may get profit. But you will lost in case the market cycle changes its frequency.
- Noxa indicator is not adaptive, only identify unique cycle (certain frequency) for certain period and it will not change in case market cycle change it frequency.

I think I really need an Adaptive noxa cycle..Noxa please advice.

Cheers,
Arry


Arry,

The rationale with CSSA is that price moves in cycles which are persistent for enough time to make money out of it. Cycles might last for some time and several of them can coexist but they are going to change…

When you think about it, any system needs to be adjusted from time to time to new market conditions. When you hit one of those periods where the market is changing without adjusting, you lose money.

It’s no different with CSSA.

Now you certainly understood from my previous posts that we have little or no faith in adaptive indicators because they lag. You cannot have zero-lag adaptive indicators. The Eisenberg principle applies.

But there is still hope:

One possibility is to adapt in a piecewise fashion. Let’s say you have identified a few cycles that worked in the past. You would need to watch your model for a while and see whether the market settled down before making a decision as to what cycle to trade. E.g., for each of the cycles you would get a consensus for reversion prior to a threshold you have set from other models before pulling the trigger.

Another possibility would be to feed a neural net with a few of these cycles. The net would weight the cycles according to recent developments in the market…

Noxa
 
>> Regarding naming lag or persistence. It must be your naming, first time i hear this.
Now you know about persistence.


>> That's true and this is a problem because there is no guarantee than the pattern learned from training range will occur in the future.
I agree! But isn’t that obvious that we all don’t know the future? So this problem is even worse for indicators (adaptive or not) with no learning capacity.


Let me wrap up on the “Only one known to ‘you’ oscillator” issue before moving on:

You wrote in your post #276: http://www.trade2win.com/boards/771856-post276.html
>> I gave the Ehlers sinwave oscillator as an example how indicator should act in case of
>> switch from trend with cycles to pure trend. My statement 'resistance' was that sine
>> and leadsine will not cross in case of switch to trend mode so false signals will not be
>> generated.
>>So lets wait for your settings which will recognise cycles from the left part of the chart
>> properly and don't generate false signals after switch to trend mode

It appears that the Ehlers sinwave indicator badly failed in recognizing the cycles and not generating false signals as you stated which I have shown is impossible to achieve. Do you agree that your choice of the Ehlers sinwave indicator was completely irrelevant?

Noxa

I have only chosen Ehlers sinwave to show how indicator should act in case of regime change. That Ehlers sinwave is not able to pick up the cycles from noised signal it is another story.

What is impossible to achieve ? If your indicator would have very small fixed lag like Hilbert transform used in sinwave than it would generate none or just one false signal.
If it is possible to achieve or not I don't know. Hilbert transform this is instant frequency measurement technique (IFM), a lot of such techniques is known, if they are used in indicators I don't know.

Krzysztof
 
MESA8 sine/sinelead

Hi Arry,

I think you have MESA8 indicators. Can you take a .csv from post 242 and post screen shoot of sine/sine lead from MESA8 ?? Than we will see what the lag and behaviour is.

Krzysztof
 
CSSA can be set to capture the cycles of interest with minimum persistence

I think you are trying to hide the problem here. By setting incorrectly m-history to 25 you are trying to decrease the lag. Correct setting to resolve cycles 20/50/100 is minimum 100, to resolve long forex cycles is minimum 200. Than there is a lot of false QPhase orders against the trend. See screen shoot.

So no exact settings to resolve this problem ?? Is is fixable ??

Krzysztof


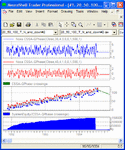
You said in your post#283
>> I changed the m-mistory to show this without changing the group because there was no change in contents of the signal so no change in significiant eigenvectors.
The eigenvectors changed as you can see below (different time support, different number of periods):
- Left graph: m-histories = 50 bars
- Second graph from the left: m-histories = 250 bars

>> I think you are trying to hide the problem here. By setting incorrectly m-history to 25 you are trying to decrease the lag.
This is becoming ridiculous!! I kept the setting from post#261. m-histories was set manually by visually guessing the periodicities in your data. Recall that we make things time relevant. 50 bars were about right so we have set m-histories to 25 bars to be able to capture it. We then looked for a component which provides a good fit with the data and capture the full period. See third graph from the left. There is nothing wrong with that. It is perfectly correct.

>> Correct setting to resolve cycles 20/50/100 is minimum 100, to resolve long forex cycles is minimum 200
This approach is fundamentally wrong. This is backward curvefitting as far as your toy example is concerned. The data does not give clues for 200 bars period cycles so there is no reason to set m-histories to 100bars.

>> So no exact settings to resolve this problem ?? Is is fixable ??
To confirm that our setting was correct, we have run a few quick optimizations (see below). They returned m-histories values in the 40 bars ballpark and the false signals are sill limited to a minimum. There is nothing to fix.

It’s about time to "Do whatever works best". If you stick to making things time relevant, CSSA can be set to capture the cycles of interest with minimum persistence.

Noxa
 

Attachments

  • cc6.gif
    cc6.gif
    23.6 KB · Views: 496
  • cc7.gif
    cc7.gif
    21.4 KB · Views: 498
  • cc3-1-25.gif
    cc3-1-25.gif
    6.2 KB · Views: 328
  • cc4-1-250.gif
    cc4-1-250.gif
    6.5 KB · Views: 284
  • cc4-1-50.gif
    cc4-1-50.gif
    6.4 KB · Views: 376
You said in your post#283
>> I changed the m-mistory to show this without changing the group because there was no change in contents of the signal so no change in significiant eigenvectors.
The eigenvectors changed as you can see below (different time support, different number of periods):
- Left graph: m-histories = 50 bars
- Second graph from the left: m-histories = 250 bars

>> I think you are trying to hide the problem here. By setting incorrectly m-history to 25 you are trying to decrease the lag.
This is becoming ridiculous!! I kept the setting from post#261. m-histories was set manually by visually guessing the periodicities in your data. Recall that we make things time relevant. 50 bars were about right so we have set m-histories to 25 bars to be able to capture it. We then looked for a component which provides a good fit with the data and capture the full period. See third graph from the left. There is nothing wrong with that. It is perfectly correct.

>> Correct setting to resolve cycles 20/50/100 is minimum 100, to resolve long forex cycles is minimum 200
This approach is fundamentally wrong. This is backward curvefitting as far as your toy example is concerned. The data does not give clues for 200 bars period cycles so there is no reason to set m-histories to 100bars.

>> So no exact settings to resolve this problem ?? Is is fixable ??
To confirm that our setting was correct, we have run a few quick optimizations (see below). They returned m-histories values in the 40 bars ballpark and the false signals are sill limited to a minimum. There is nothing to fix.

It’s about time to "Do whatever works best". If you stick to making things time relevant, CSSA can be set to capture the cycles of interest with minimum persistence.

Noxa

Here is a piece of CSSA help file

It is worth noting that SSA does not resolve periods longer than m-histories. m-histories is the maximum period (in bars) that can be detected.

So is clear than for 20/50/100 cycles in order to resolve 100 bar cycle we need 100 m-history

Anyway main point here is bigger m-history (called lag in other SSA aplication) ==> bigger lag or persistence ==> more false orders

It is clearly proven in post 284.

Dominant forex cycles for EURUSD 5m have length like 140 than 230-300 bars than you can see that use of big values of m-history is a must here

Krzysztof
 
hi Noxa and Krzysztof!

Nice discussion. Just two questions:

- Is there any working/"proved" CSSA system which work in forex? (Intraday?, not Daily bars) as Krzysztof reuqested?

- So in fact that (I understood it this way) it is not usefull to use a m-history more than 50 (max. 100) is it possible to use bigger TF, Krzysztof?
As, if you say, a forex-cycle is about 12hours, than use 30Min./15min. TF, would that be a solution or isn't that "easy"?

Thanks and bye, AT
 
- So in fact that (I understood it this way) it is not usefull to use a m-history more than 50 (max. 100) is it possible to use bigger TF, Krzysztof?
As, if you say, a forex-cycle is about 12hours, than use 30Min./15min. TF, would that be a solution or isn't that "easy"?


It is possible to use bigger TF but you will lose precision of entry in this case simple because you will have signal at the bar close which will happen less frequent. So the key here is to resolve cycles with long periods from low TFs. I don't know if you observe FOREX real time but the big movements happens very fast and be late is a disaster because most likely there are systems which can act fast enough. So key is a fast reaction to the price move and it means no lag and low TF.

Krzysztof
 
It's working.. at least on this one

hi Noxa and Krzysztof!

Nice discussion. Just two questions:

- Is there any working/"proved" CSSA system which work in forex? (Intraday?, not Daily bars) as Krzysztof reuqested?

- So in fact that (I understood it this way) it is not usefull to use a m-history more than 50 (max. 100) is it possible to use bigger TF, Krzysztof?
As, if you say, a forex-cycle is about 12hours, than use 30Min./15min. TF, would that be a solution or isn't that "easy"?

Thanks and bye, AT

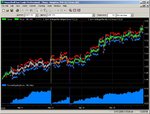
I created dozens of Noxa strategy - maybe hundreds, because I don't remember exactly. Most of them don't show consistent profit. The best one is attached GBPUSD chart, 15 minutes timeframe. I created this one on May 14th and let it run until today, profiting about 1,000 pips.

Left side of the yellow vertical line is optimizing data set, between yellow and purple line is paper trading, and the right side of purple line is out of sample period. Like Noxa said, Trainstart + Trainbars must not exceed yellow vertical line.

My tips using CSSA: don't rely heavily on GA optimizer. There are certain parameter limits that you must set manually. If you know these limits then most likely you can get consistent profits.
 

Attachments

  • screen5.jpg
    screen5.jpg
    114.6 KB · Views: 712
  • screen6.jpg
    screen6.jpg
    68.5 KB · Views: 547
  • screen7.jpg
    screen7.jpg
    53.5 KB · Views: 518
Detect market frequency change

Kim-Kim,

As long as the market frequency is consistent with optimization data, the profit using noxa oscillator should be consistent.

Noxa, it there any tools to detect the change of market frequency? using Noxa Entropy should detect when the market frequency almost same as the optimized oscillator.

Thank you,
Arry
 
Forex prediction GBPJPY 15 minutes chart

I created this one last saturday. I set OOS period for 3 days last week to see behaviour of the prediction model and then continue starting from today.

Inputs of prediction are Noxa Oscillator of 3 currency pairs: GBPJPY, GBPUSD and USDJPY. As we know GJ movement is very much affected by movement of GU and UJ pairs.

This predicton model disregard spread of the broker. Total profit for 3,5 days of trading is about 750 pips. Taking spread into account (9 pips in GBPJPY - FXDD) it will be only 410 pips profit, still not too bad. Let's see how it goes until end of this week.
 

Attachments

  • Input.jpg
    Input.jpg
    35.4 KB · Views: 531
  • GBPJPY Prediction.jpg
    GBPJPY Prediction.jpg
    125.7 KB · Views: 547
  • Closer look.jpg
    Closer look.jpg
    119.5 KB · Views: 533
Last edited:
Kim-Kim,

As long as the market frequency is consistent with optimization data, the profit using noxa oscillator should be consistent.

Arry

Hi Arry,

Could you please elaborate more on market frequency? Is it the same as market cycle?
 
Market frequency

Hi Kim Kim,

Apologize if my understanding is not correct.

If we make a smoothing (using EMA) from the price data (close or else) or transform it into a wave form (using noxa, Mesa or else) then we will get a different form of our data. Since this new wave is like sinusoidal form, I call as cycle.

Any cycle has peak and valley, distance from mid point to the peak/valley (vertical) is cycle amplitude (A) and horizontal distance between peak to peak or valley to valley is cycle period (T) (measure in time unit,e.g. second). Frequency is defined as 1/T to measure how many cycles occurred/second (unit is Hertz).

The amplitude of cycle is not become my intension, it is only related with how many proft/drawdown we can get from any trade position. Our intention is only to know the frequency.

Related with my concern that noxa cycle is formed to identify a certain market cycle frequency only and it was not adaptive for any new market frequency. All settings are made manually.

I consider to use NEI since it may be used to identify wether the ongoing market cycle form is similar with the identified cycle.

Any correction is welcome.

Good luck,
Arry
Hi Arry,

Could you please elaborate more on market frequency? Is it the same as market cycle?
 
@arry
Thanks for the explanation.

My experience using CSSA:
Cycles in forex can change very quickly especially for smaller timeframe. In this case, detecting forex cylce using Noxa is not practical because we have to do it manually and frequently. Also, we can't afford to wait until equity line goes down, only to know that market cycle is already change. We have to check the cycles BEFORE equity line goes down.

Using GA optimizer is another problem. I often found GA results perform very poor and unstable. Sometimes I stop the optimization process (when I see good Win/Loss ratio and % return) and compare with complete optimization result. Half optimization can outperform complete optimization with huge difference. The problem is: we don't know WHEN to stop. It is very much like GUESSING. Plus, we must be in front of the computer during the optimization process. I can wait for 5-10 minutes, but no thank you if it takes 30-60 minutes.

Still, I think CSSA got potential. My GBPUSD chart can hold equity line until now. I neither change parameter nor re-optimize it. My GBPJPY prediction chart doesn't perform well.
 

Attachments

  • screen9.jpg
    screen9.jpg
    109.7 KB · Views: 584
  • screen10.jpg
    screen10.jpg
    103 KB · Views: 535
Top