Noxa indicators for Neuroshell

This is worthless

What i want to say based on my understanding of this problem is based on post 254:


So

1) We have down trend and E0 are generating buy signals and this is a fault
because the small sine cycle is generated

2) To avoid this we find the threshold for QPhase which will filter out those entries.

but this solution don't fix fault but just covers it. It not generic solution,
just a patch for this certain case. So if the an amplitude of this sin will change because of whatever (like changing of slope of the line) we will have a faulty entries again ??? It was for me backward fitting.

Krzysztof

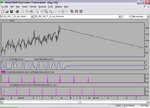
1. Your artificial signal is not a down trend but a down line. As a result CSSA produces a small cycle of amplitude < 0.0000001 which is very much expected; it picks up floating point errors in your data as many other indicators do (see plot attached). This cycle is real and there is nothing wrong with that.

To wrap up on this, the small cycle produced is not "CSSA's fault" but is due to your data. CSSA is smart enough to pick it up and the cycle is small enough for you to discount it. As a general rule in trading I strongly suggest that you do sanity checks.


2. To address your artificial problem I suggested that you use QPhase instead but you'll have to generate the signals yourself. Crossovers are the solution. There is no patch, no backward curve fitting of any kind, not even threshold setting or any other silly sauce argument you might come up with; just bare trading through simple indicator crossovers.

Noxa
 

Attachments

  • Down line noise.gif
    Down line noise.gif
    25.7 KB · Views: 418
Serious matter!


Thanks acj28.

Good detective work. Much appreciated!

That would explain a lot of what is going on on this thread.

To Krzysztof: do you use a pirated version of the NeuroShell Trader as these links seem to indicate?

Comments?

Noxa
 
Thanks acj28.

Good detective work. Much appreciated!

That would explain a lot of what is going on on this thread.

To Krzysztof: do you use a pirated version of the NeuroShell Trader as these links seem to indicate?

Comments?

Noxa

No. I think this test alpha version does not handle your indicators, you should know it :)

Krzysztof
 
1. Your artificial signal is not a down trend but a down line. As a result CSSA produces a small cycle of amplitude < 0.0000001 which is very much expected; it picks up floating point errors in your data as many other indicators do (see plot attached). This cycle is real and there is nothing wrong with that.

To wrap up on this, the small cycle produced is not "CSSA's fault" but is due to your data. CSSA is smart enough to pick it up and the cycle is small enough for you to discount it. As a general rule in trading I strongly suggest that you do sanity checks.


2. To address your artificial problem I suggested that you use QPhase instead but you'll have to generate the signals yourself. Crossovers are the solution. There is no patch, no backward curve fitting of any kind, not even threshold setting or any other silly sauce argument you might come up with; just bare trading through simple indicator crossovers.

Noxa
There is nothing wrong with my signal here - it's just pure trend. It seems that CSSA is
just like most of other oscillators (like stochastic) generating false signals when market is in 'trend mode' and E0 false entries are based on dedection of this non existing cycles.

Only one known to me oscillator which is resistant to this is John Ehler's sinwave indicator. Unfortunatelly CSSA does not have this 'resistance' build in.

See sinwave screeshoot, it does not cross for pure trend (no phase change) so trend mode is recognised.

For NOXA. Can you post the setup of your indicators which will work efficient on both
sides of my signal so recognize the cycles and don't generate false signals after switching to pure trend ?? Obvioulsy QPhase at least with settings 250,4,1,0...cross with 0 generate them.

Krzysztof
 

Attachments

  • QPhase.JPG
    QPhase.JPG
    74.7 KB · Views: 451
Last edited:
Beware of crooks II !

krzysztof krzysiaczek99 = fajst_k

He stole NOXA too!!!!!!!!!!!!!!!!!!!!!!!!!!!!!!
 

Attachments

  • crook#218_19 krzysiaczek99 fajst_k.gif
    crook#218_19 krzysiaczek99 fajst_k.gif
    18.4 KB · Views: 617
Hi Guys -

For the purpose of CSSA, Lissajous plots are apparently "best found as a circular-looking plot, for example, shows that two (eigenvector) components are related by being persistently ninety degrees out of phase with each other".

My question is - does this mean the two cycles are the same frequency? If not, how can we discuss them being 90 degrees phase?

Stewart
 
krzysztof krzysiaczek99 = fajst_k

He stole NOXA too!!!!!!!!!!!!!!!!!!!!!!!!!!!!!!

I was asking for password to zip file posted on this forum as one of the users was claiming that inside this file they are NOXA indicators, however I think it was a cheat and he simple wanted to resell this zip file.

So Acj28., This is technical forum is about NOXA indicators. Can you add some valuable info here ?? maybe something about lag, adaptiveness or the last problem with QPhase and switching to the trend mode ??

Krzysztof
 
Krzysztof - I'd back Acj28 up here too.

Both Noxa and Ward Systems are small companies doing what I'd consider a great job. If you're using their software it's fair to pay for it. The more people who do, the better their products get and the better our trading gets.

Noxa have been really helpful responding to your ideas on this thread - hopefully it's a two way street.

Yes, they are doing great job but i believe you are getting very selective info about technical parameters of their products. They don't offer evaluation versions of their products, they don't publish test reports, only showing the cases when their products work. So you buy a car without knowing how it's engine performs overall.

See for example John Ehlers books how he evaluate his indicators, only on Jurik site i was able to find kind of proper comparative analysis for his indicators against the others done against analytic signals to see clearly technical parameters.

Anyway I believe in this thread i touched the most of the technical tags ( known to me)
of the 'good or 'bad' indicator so anybody can repeat similar test with other indicators and compare.


Krzysztof
 
Case of license agreement violation

No. I've got your package for test for free from another person.

Krzysztof

I see!

“this AGREEMENT permits you to use one copy of the specified version of the SOFTWARE, for internal purposes only, on only one computer, and only by one user, at a time”

Non-compliance with this obligation constitutes a material violation of our license Agreement.

I don’t think you have any objection that I check with Ward System Group whether you are a legit user of the NeuroShell Trader or not. Do you?


I'll let the readers of this thread decide for themselves the reliability and pertinence of your posts.

Noxa

The person who gave me your indicators don't use them so there is no violation or whatever.

Anyway It seems that when it came to give the answers for a topics like lag, market adaptiveness of CSSA or strange orders against the trend you start to avoid those answers. From my point of view I know enough about NOXA indicators, i never used them in trading and most likely will never use at least in this version.

Regarding the reliability and pertinence of your posts. Are you using double nickname on this forum ?? P.Z. maybe ??:)

Krzysztof
 
Case of data manipulation

There is nothing wrong with my signal here - it's just pure trend. It seems that CSSA is
just like most of other oscillators (like stochastic) generating false signals when market is in 'trend mode' and E0 false entries are based on dedection of this non existing cycles.

Only one known to me oscillator which is resistant to this is John Ehler's sinwave indicator. Unfortunatelly CSSA does not have this 'resistance' build in.

See sinwave screeshoot, it does not cross for pure trend (no phase change) so trend mode is recognised.

For NOXA. Can you post the setup of your indicators which will work efficient on both
sides of my signal so recognize the cycles and don't generate false signals after switching to pure trend ?? Obvioulsy QPhase at least with settings 250,4,1,0...cross with 0 generate them.

Krzysztof


>> There is nothing wrong with my signal here - it's just pure trend. It seems that CSSA is just like most of other oscillators (like stochastic) generating false signals when market is in 'trend mode' and E0 false entries are based on dedection of this non existing cycles.

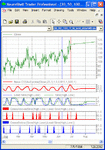
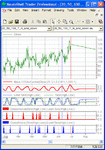
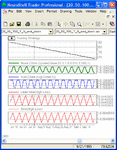
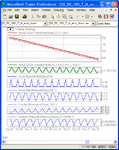
You are wrong again! Using artificial downtrends in the NeuroShell Trader generates aliasing patterns from floating-point round-off errors. A software tester should be aware of that. These patterns are real as my previous post showed. Have a look at the screenshot attached (left graph). The third curve from the top (blue curve) is a detrended simple moving average. As you can see, it has the same periodicity than the CSSA cycle. Simple moving averages do not lie therefore this signal is real. A good indicator has to pick it and I would worry if it did not.


>> Only one known to me oscillator which is resistant to this is John Ehler's sinwave indicator. Unfortunatelly CSSA does not have this 'resistance' build in.

There it is! John Ehler's sinwave indicator…Have a look at the chart below again; the two bottom curves are John Ehler’s sinwave and lead sinewave. This time though there are shown individually so that a zoom is possible. Guess what! They both exhibit a line with the same periodicity than all indicators I used so far. What is the built in resistance of the sinewave indicator you refer too? Comments?

We have here the perfect case of data manipulation which consists of making a false statement and hiding the facts.


>> See sinwave screeshoot, it does not cross for pure trend (no phase change) so trend mode is recognised.

Wrong again! Facts are hidden and perfect case for “backward curve fitting”. See chart attached. The middle chart shows the signals from the crossover of a sinwave and a lead sinewave. It does cross indeed for pure trend; a short signal occurs after the red vertical line. The bottom right chart shows the signals when the slope of the artificial trend has been changed. Guess what! We have now two wrong entry signals after switching to pure trend side this time. How come?

BTW the signals generated by the sinewave crossover are quite poor; prohibitive lag, multiple false signals but I digress. Just interesting to note!


>> For NOXA. Can you post the setup of your indicators which will work efficient on both
sides of my signal so recognize the cycles and don't generate false signals after switching to pure trend ?? Obvioulsy QPhase at least with settings 250,4,1,0...cross with 0 generate them.

Coming.


Noxa
 

Attachments

  • 20-50-100-T-N and down #5.gif
    20-50-100-T-N and down #5.gif
    25.9 KB · Views: 422
  • 20-50-100-T-N and down #4.gif
    20-50-100-T-N and down #4.gif
    25.9 KB · Views: 477
  • 20-50-100-T-N and down #3.gif
    20-50-100-T-N and down #3.gif
    23.3 KB · Views: 473
>> There is nothing wrong with my signal here - it's just pure trend. It seems that CSSA is just like most of other oscillators (like stochastic) generating false signals when market is in 'trend mode' and E0 false entries are based on dedection of this non existing cycles.

You are wrong again! Using artificial downtrends in the NeuroShell Trader generates aliasing patterns from floating-point round-off errors. A software tester should be aware of that. These patterns are real as my previous post showed. Have a look at the screenshot attached (left graph). The third curve from the top (blue curve) is a detrended simple moving average. As you can see, it has the same periodicity than the CSSA cycle. Simple moving averages do not lie therefore this signal is real. A good indicator has to pick it and I would worry if it did not.


>> Only one known to me oscillator which is resistant to this is John Ehler's sinwave indicator. Unfortunatelly CSSA does not have this 'resistance' build in.

There it is! John Ehler's sinwave indicator…Have a look at the chart below again; the two bottom curves are John Ehler’s sinwave and lead sinewave. This time though there are shown individually so that a zoom is possible. Guess what! They both exhibit a line with the same periodicity than all indicators I used so far. What is the built in resistance of the sinewave indicator you refer too? Comments?

We have here the perfect case of data manipulation which consists of making a false statement and hiding the facts.


>> See sinwave screeshoot, it does not cross for pure trend (no phase change) so trend mode is recognised.

Wrong again! Facts are hidden and perfect case for “backward curve fitting”. See chart attached. The middle chart shows the signals from the crossover of a sinwave and a lead sinewave. It does cross indeed for pure trend; a short signal occurs after the red vertical line. The bottom right chart shows the signals when the slope of the artificial trend has been changed. Guess what! We have now two wrong entry signals after switching to pure trend side this time. How come?

BTW the signals generated by the sinewave crossover are quite poor; prohibitive lag, multiple false signals but I digress. Just interesting to note!


>> For NOXA. Can you post the setup of your indicators which will work efficient on both
sides of my signal so recognize the cycles and don't generate false signals after switching to pure trend ?? Obvioulsy QPhase at least with settings 250,4,1,0...cross with 0 generate them.

Coming.


Noxa

Let's put it in this way. The problem is clearly shown in post 242 and 265 CSSA generates orders against the trend either in case of E0 and QPhase indicators.

If CSSA picks the cycles from simple down line and on base of this generate those orders it means it's is simple oversensitive, it should generate just one sell order immediatelly after change to trend mode and hold the position.

I gave the Ehlers sinwave oscillator as an example how indicator should act in case of switch from trend with cycles to pure trend. My statement 'resistance' was that sine and leadsine will not cross in case of switch to trend mode so false signals will not be generated.

So lets wait for your settings which will recognise cycles from the left part of the chart
properly and don't generate false signals after switch to trend mode. Hopefully those settings will be generic i.e. they will still work in case of change for example slope of this line.

Personally I think that we deal with 2 problems here lag and oversensivity.

FYI, cycles at the left side are 20/50 and 100 bars period.

Krzysztof
 
Down to the transitioning from one regime to another one

Let's put it in this way. The problem is clearly shown in post 242 and 265 CSSA generates orders against the trend either in case of E0 and QPhase indicators.

If CSSA picks the cycles from simple down line and on base of this generate those orders it means it's is simple oversensitive, it should generate just one sell order immediatelly after change to trend mode and hold the position.

I gave the Ehlers sinwave oscillator as an example how indicator should act in case of switch from trend with cycles to pure trend. My statement 'resistance' was that sine and leadsine will not cross in case of switch to trend mode so false signals will not be generated.

So lets wait for your settings which will recognise cycles from the left part of the chart
properly and don't generate false signals after switch to trend mode. Hopefully those settings will be generic i.e. they will still work in case of change for example slope of this line.

Personally I think that we deal with 2 problems here lag and oversensivity.

FYI, cycles at the left side are 20/50 and 100 bars period.

Krzysztof


Ok! We are now down to the transitioning issue from one regime to another one.

Just want to wrap up the “ghost signals” saga before moving on. I have shown that these signals were real and came from a byproduct of using artificial data. I stress out that special care is required when using artificial data. It is not too much of a stretch I think to conclude that you finally agree on this. Correct me if I am wrong.

As for the sinewave crossover I also have shown an example were it fails already at detecting the artificial trend. I would be sarcastic if I asked you to name another “only one known to you oscillator” that is not producing such false signals in the transition region because such indicator does not exist. It’s all relative. Do you agree?


>> FYI, cycles at the left side are 20/50 and 100 bars period.

Thanks for giving that information away but I don’t care. Using it one way or another would be “backward curve fitting” since I am not supposed to know it. I’ll set the parameters that work well on only part of the left side (in-sample) and see how the out-of-sample transitioning goes.

Noxa

Regarding small sin cycle and your detrending operation SUB(Close(avg(close,5)) which
suppouse to prove that the cycle is real. I think this operation in not detrending but decycling i.e. by subtracting 5 SMA from close you are removing 5 bar cycle component from close. So what is left is just a trend if close was build like trend + 5 bar cycle. So I really don't know what to think about it, see screenschot from 'Rocket of Science..

But I think it really does not matter from when it comes from.

Regarding Sinwave. Yes it makes false signal at change from cycle mode to trend mode, it is also described in Ehler's book but later doesn't make any false signals.

Anyway, your settings are the key here as you know insides how CSSA works.

Krzysztof
 

Attachments

  • de.JPG
    de.JPG
    154.2 KB · Views: 455
Regarding small sin cycle and your detrending operation SUB(Close(avg(close,5)) which
suppouse to prove that the cycle is real. I think this operation in not detrending but decycling i.e. by subtracting 5 SMA from close you are removing 5 bar cycle component from close. So what is left is just a trend if close was build like trend + 5 bar cycle. So I really don't know what to think about it, see screenschot from 'Rocket of Science..

But I think it really does not matter from when it comes from.

Regarding Sinwave. Yes it makes false signal at change from cycle mode to trend mode, it is also described in Ehler's book but later doesn't make any false signals.

Anyway, your settings are the key here as you know insides how CSSA works.

Krzysztof

It remains that all indicators that I tried even including the sinewave indicator showed a periodic signal with exactly the same period. This is not pure coincidence.

>> Regarding Sinwave. Yes it makes false signal at change from cycle mode to trend mode, it is also described in Ehler's book but later doesn't make any false signals.

As does the QPHase crossover as I'll show soon. The key here is the crossover operation. If we were to generate signals from the sinewave indicator by looking at its local extrema as we do in Entries#0 it would generate multiple false entries as well. There are many use for false signals... We also provide QPhase so that you can generate the signals yourself through a crossover as it is with the sinewave.

Noxa
 
More on EigenSpectrum

Hi Guys -

For the purpose of CSSA, Lissajous plots are apparently "best found as a circular-looking plot, for example, shows that two (eigenvector) components are related by being persistently ninety degrees out of phase with each other".

My question is - does this mean the two cycles are the same frequency? If not, how can we discuss them being 90 degrees phase?

Stewart

Stewart,

This is correct. Two cycles accounting for a similar amount of variance have a similar period. If they happen to be in quadrature their lissajous plot appears circular (see ShowEigenvectors plot attached).

Let me quote wikipedia: Singular spectrum analysis - Wikipedia, the free encyclopedia
“An oscillatory mode is characterized by a pair of nearly equal SSA eigenvalues and associated PCs that are in approximate phase quadrature (Ghil et al., 2002). Such a pair can represent efficiently a nonlinear, anharmonic oscillation. This is due to the fact that a single pair of data-adaptive SSA eigenmodes often will capture better the basic periodicity of an oscillatory mode than methods with fixed basis functions, such as the sines and cosines used in the Fourier transform.”

I don’t want to scare the readers of this forum. ShowEigenvectors can be used in a very casual way by just looking for plateaus or any kind of structure more than just a quick drop of the spectrum. Issues that exhibit such structure in the eigenspectrum are usually easier to trade.

But for the adventurous among you who want to take a closer look you can read these papers:
http://www.aos.wisc.edu/~dvimont/aos575/Handouts/Chapter6d.pdf
http://mpra.ub.uni-muenchen.de/4991/2/MPRA_paper_4991.pdf

Noxa
 

Attachments

  • se3.gif
    se3.gif
    9 KB · Views: 366
Last edited:
Top