bchung3000
Junior member
- Messages
- 29
- Likes
- 0
Right bchung, Cemex went back down to restest support and bounced off. It is at same price I went long yesterday now. Im still in and expecting it to spike up into the close or tomorrow. The malfunction of H&S pattern for the index, is kind of the same for H&S pattern for Dow. Glad you re making money, which is the objective of this game.
Hi dpinpon. Looks like there is a pretty bearish divergence with the MACD. Also with the Mexico index. I think CEMEX is becoming rather choppy to trade. :-0
I tried posting a chart of the DJIA but was unsuccessful even after uploading the image to this site. There is a divergence on the head and shoulders between DJIA and DJ utilities. Many trading books show this as a sign of lower prices ahead. This is a very classical sign which proceeded the 1974 bear market.
I was able to upload it to my blog at:
http://bj139-trading101.blogspot.com/2010/07/here-is-chart-of-djia-with-dj-utilities.html
Hi BJ139
Was it this divergence (one at the left shoulder and one on the head) that you were refering to? vs the dj utilities.
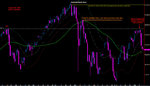
Here is my long term Dow chart with my favorite indicators below it. You can put the same indicators on any time frame and they work very well. I have a modified stochastic with the MA's set at 34, 13 and 8, and a fractal indicator on top of that. It's not perfect but it's very good I think.
I only trade forex and the dow is the only stock index I follow.
Hi JahDave
Looks like the indicator you mentioned is pretty strong. May I know what inspired you to combine stochastic and MA together as one?
I am starting to think that the head and shoulder is a failure. 👎