'No indicators' revisited

Your Query ~ tweezer bottom variant

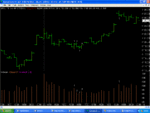
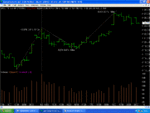
Yes, certainly with pleasure. Observe that there are 4 bars on this bottom.
The first 3 are supported at 1453.5 . This is a "gate" that has been shut tight, to prevent the price from slipping south past the support level marked by the previous low at 1453 level.
Notice carefully that on this second low the volume is higher than that attributalble to the market action that precedes it on the downmove from 1462.5.
The next bar, is allowed to drop slightly lower to 1453, and no lower. Here an ambush has been laid to snap up the instrument at that price. The volume is higher is it not ? The close to this bar is near the top, this close being the open of the next bar which also closes on the high,
but on lower volume. This shows that the ambush has been successful and up it jolly well goes. Not much effort to carry on, because not much is needed. Beautiful ! Well done !
Thsi is an example, a classic example in which an ambush mounted does not succeed on the first attempt, but a tiny drop lower leads to success. All it needs is for a stop on a big position to be triggered for the piece missing from the jigsaw puzzle to be made fo fall in at the right time and of course the right place. Excellent ! Well done !
 
clylbw said:
This post is actually a side note, not directly related to price-action-only trading.

I have just finished suffering from International Finance, during which our two professors had for the past whole year tried to stuck into our heads ideas such as market efficiency, purchasing power parity and other parity conditions. The effect? I nearly went asleep during each lecture.

I do realise that a great part of traders and investors do not beat the market in the long run. However, how am I supposed to believe in Random Walk when certain patterns such as the tweezer bottom (cheers SOCRATES) has happened again and again and made me money during the past month alone? Maybe all those great theories do hold in the long run, but, as it is said, in the long run we are all dead, who cares?????

(Sorry just being frustrated. Please ignore the post if so wished.)

Private route please.
 
Volume study June 1st

Dear darksiders :LOL:

I am posting here my interpretation of price-volume action on June 1st. This is the 1st time I openly attempt to analyse volume component :cool: PLS PLS SLAP ME WITH A BIG TROUT IF I AM MISINTERPRETING SOMETHING HERE!!! :devilish: Whipping will be much appreciated! :LOL:

I am working off a 2 min chart with blue line being 5 ma on volume - essentially normalised 10 min bar volume.

A - start of the day. Price is going up on decreasing buying, No particular big money buying, already spelling trouble for bulls. 10:00 spike in price and volume, longs are closing their positions to see what happens. The spike in volume is closing longs. NOTE: IT IS HAPPY CLOSING as bulls r closing on higher ES and racking in profits. Also good point for those who stayed long from before to jump out flat. The market is largely flat, so the next spike in ES (10:16) is happily welcomed as a chance to enter into short positions - spike in volume is operators shorting here.

B - volume decreases on a move down, but slightly, not drying up. Volume bars r still quite significant. Shorts r already clocking up points and anticipating another leg down. Line B does get interrupted at 10:50, where some operators r trying to call "double bottom" and start buying. However, right after this spike in volume, line B continues to decrease. THAT MEANS ONLY ONE THING TO ME - that double bottom call DOES NOT IGNITE SHORT COVERING!!!! What is most likely to follow?

C - No short covering previously brings new shorts into the play. Volume increases on ES tanking. THE MARKET BECOMES EVEN MORE SHORT. However at 11:28 and 11:30 we get 2 up bars on significant volume, actually only a tad lower than at reent selling climax. Smart operators realise it is a no-trend day, and some shorts start taking profit covering their shorts. 11:40 - late shorts (small money herd) manages to take ES lower but on smaller volume - obviously small money late crowd who belatedly got convinced it is a big down move coming up.

D and E - 2 hour long attempt by the smaller money crown to play the bounce. What does decreasing volume tell us? GENERALLY THE BIGGER OPERATORS THAT ARE STILL SHORT R UNWILLING TO FULLY COVER THEIR SHORTS! The price action is quite clear - what the bulls view as a bull flag in the making cannot deliver - no panic short covering yet, shorts r in the money, so to speak. NO REVERSAL YET!! Btwn roughly 13:30 and 14:00 new attempts (small so far) to short the mrkt take out 1117 - the support of what bulls wud like to see as the bull flag - and the big shorts r not rushing to cover shorts at lower levels. What is to follow?

F - New wave of selling obviously on increasing down volume. WHAT IS LOADS MORE INFORMATIVE THO IS WHAT FOLLOWS

G - ES takes its breath on the way down, volume dries up. BEARS HAVE THE CHANCE TO BRING IT FURTHER DOWN BIG TIME BUT FOR 40 SOLID MINUTES THEY R NOT DOING SO!!!!! 40 minutes - decreasing volume (line G) with bears not taking their chances!!! What happens? 14:58 - first serious wave of short covering. NOTE - this is HAPPY closing of the positions, as shorts cover at a profit.

H - now btwn 15:00 and 15:26 the table is seemingly turned, as the bulls SEEMINGLY cannot take it up just as much as the bears cud not take it down on line G. THERE IS ONE PROBLEM FOR THE BEARS THO: on line H volume starts steadily increasing, opposite to volume dying off on stage G. What does that mean????

ONLY ONE THING - MORE AND MORE SHORTS R TRYING TO COVER WHILST THEY CAN STILL DO SO AT A PROFIT! that in turns brings in new bulls (genuine long positions). COVERING TURNS INTO PANIC - AND THIS IS NO LONGER HAPPY COVERING, SHORTS R EXITING AT A LOSS! H line in volume keeps on rising into the close. U will note that 16:02 volume bar (after the cash close) is actually the highest 2 min volume bar OF THE WHOLE DAY! Noone wants to saty short into the close, and the big money is positioning itself long for tomorrow.

WHICH perhaps mean that any gap up at tomorrow's open will most likely cause a big trend up day. Compare visually the square "surfaces" under down volume time periods of today and those under up volume time periods. The market is no longer short.

Darksiders - pls let me know if i am correct - or if all of this is a cartload of faff :LOL:
 

Attachments

  • E-Mini S&P 500 (Jun. 2004)- 2 minute.jpg
    E-Mini S&P 500 (Jun. 2004)- 2 minute.jpg
    60 KB · Views: 434
china white said:
Dear darksiders :LOL:

I am posting here my interpretation of price-volume action on June 1st. This is the 1st time I openly attempt to analyse volume component :cool: PLS PLS SLAP ME WITH A BIG TROUT IF I AM MISINTERPRETING SOMETHING HERE!!! :devilish: Whipping will be much appreciated! :LOL:

I am working off a 2 min chart with blue line being 5 ma on volume - essentially normalised 10 min bar volume.

A - start of the day. Price is going up on decreasing buying, No particular big money buying, already spelling trouble for bulls. 10:00 spike in price and volume, longs are closing their positions to see what happens. The spike in volume is closing longs. NOTE: IT IS HAPPY CLOSING as bulls r closing on higher ES and racking in profits. Also good point for those who stayed long from before to jump out flat. The market is largely flat, so the next spike in ES (10:16) is happily welcomed as a chance to enter into short positions - spike in volume is operators shorting here.

B - volume decreases on a move down, but slightly, not drying up. Volume bars r still quite significant. Shorts r already clocking up points and anticipating another leg down. Line B does get interrupted at 10:50, where some operators r trying to call "double bottom" and start buying. However, right after this spike in volume, line B continues to decrease. THAT MEANS ONLY ONE THING TO ME - that double bottom call DOES NOT IGNITE SHORT COVERING!!!! What is most likely to follow?

C - No short covering previously brings new shorts into the play. Volume increases on ES tanking. THE MARKET BECOMES EVEN MORE SHORT. However at 11:28 and 11:30 we get 2 up bars on significant volume, actually only a tad lower than at reent selling climax. Smart operators realise it is a no-trend day, and some shorts start taking profit covering their shorts. 11:40 - late shorts (small money herd) manages to take ES lower but on smaller volume - obviously small money late crowd who belatedly got convinced it is a big down move coming up.

D and E - 2 hour long attempt by the smaller money crown to play the bounce. What does decreasing volume tell us? GENERALLY THE BIGGER OPERATORS THAT ARE STILL SHORT R UNWILLING TO FULLY COVER THEIR SHORTS! The price action is quite clear - what the bulls view as a bull flag in the making cannot deliver - no panic short covering yet, shorts r in the money, so to speak. NO REVERSAL YET!! Btwn roughly 13:30 and 14:00 new attempts (small so far) to short the mrkt take out 1117 - the support of what bulls wud like to see as the bull flag - and the big shorts r not rushing to cover shorts at lower levels. What is to follow?

F - New wave of selling obviously on increasing down volume. WHAT IS LOADS MORE INFORMATIVE THO IS WHAT FOLLOWS

G - ES takes its breath on the way down, volume dries up. BEARS HAVE THE CHANCE TO BRING IT FURTHER DOWN BIG TIME BUT FOR 40 SOLID MINUTES THEY R NOT DOING SO!!!!! 40 minutes - decreasing volume (line G) with bears not taking their chances!!! What happens? 14:58 - first serious wave of short covering. NOTE - this is HAPPY closing of the positions, as shorts cover at a profit.

H - now btwn 15:00 and 15:26 the table is seemingly turned, as the bulls SEEMINGLY cannot take it up just as much as the bears cud not take it down on line G. THERE IS ONE PROBLEM FOR THE BEARS THO: on line H volume starts steadily increasing, opposite to volume dying off on stage G. What does that mean????

ONLY ONE THING - MORE AND MORE SHORTS R TRYING TO COVER WHILST THEY CAN STILL DO SO AT A PROFIT! that in turns brings in new bulls (genuine long positions). COVERING TURNS INTO PANIC - AND THIS IS NO LONGER HAPPY COVERING, SHORTS R EXITING AT A LOSS! H line in volume keeps on rising into the close. U will note that 16:02 volume bar (after the cash close) is actually the highest 2 min volume bar OF THE WHOLE DAY! Noone wants to saty short into the close, and the big money is positioning itself long for tomorrow.

WHICH perhaps mean that any gap up at tomorrow's open will most likely cause a big trend up day. Compare visually the square "surfaces" under down volume time periods of today and those under up volume time periods. The market is no longer short.

Darksiders - pls let me know if i am correct - or if all of this is a cartload of faff :LOL:

Very good china ! Very well laid out ~ very well explained. Muy bien macho ! Lovely !
 
Last edited:
clylbw said:
Many thanks to both of you indeed. Excellent posts.

China and I are pleased you like it and this is the benchmark you should follow, which is the correct one and professional. His dissertation absolutely top drawer.
 
Socrates, Gracias a vos che! :)

On a serious note I am STUNNED how much volume is actually telling...... shame on me I was not paying proper attention to it before......

Once again, special thanks to all darksiders who turned my attention to this obvious-but-not-so-obvious thing! :)
 
Socrates said "This is an example, a classic example in which an ambush mounted does not succeed on the first attempt, but a tiny drop lower leads to success."

Forgive me for so rudely butting in folks, but I don't understand what Socrates meant by "the first attempt". Surely the one and only ambush is the tiny drop lower, a gunning of the stops that were placed too obviously and timidly a mere tick below the low of the previous three bars?

Lovely trade by the way clylbw. I wish I could manage the transition from nephelokokkygia to trading terra firma as swiftly and competently as you clearly have. But with threads of this quality failure is slowly becoming an option I might just be able to forgo.

The air in the dark chamber may be rarefied, but the molecules sure smell sweet.

Thank you all, as ever.


.
 
How do viewers of this thread compare the typed word with the chart that it refers to?

Once the chart is displayed one cannot read the post it is related to, most frustrating.

The best solution appears to be printing out the post and showing the chart on screen to compare the two. Which is a little long winded particularly in this computerised age

Has anyone found a better way of dealing with this problem?

I think that the previous method of showing the full size chart within the post was a better one.

Regards

bracke
 
When the chart is diplayed you have an extra window open

Re size each window so that they can be viewed alongside each other
 
qaza

Thank you for your reply. I will try that.

Just tried it and it worked. Your reply much appreciated.

Regards

bracke
 
Last edited:
bracke said:
How do viewers of this thread compare the typed word with the chart that it refers to?

Once the chart is displayed one cannot read the post it is related to, most frustrating.

Bracke, open the chart in its own window.
 
2 simply trades 2day.

Short just before open figuring it would be end of wave 5 and closed and reversed at bar 3. (10 min chart)

To tell the truth, i personally wouldn't have needed to use volume to have made these trades and would have traded these just on pattern formation, but must add that the volume did give me extra confidence in the decisions.

Decreasing volume on the move down, displaying disinterest to take the price lower. Selling volume drys up on bar 3 (lowest volume bar) with tweezer bottom bar 4 (on higher volume) confirming the unwillingness to close lower than the open of bar 1, which acts as support (also on modest volume). So long on bar 3 with stop just below bar 1.

Sold on doji bar 5 which had the highest volume (uptil then) showing strong resistance to take it higher.
 

Attachments

  • untitled.GIF
    untitled.GIF
    65.8 KB · Views: 312
Just to add, its worth noting dojis at major points.

The low doji bar of today marked 50% retracement of yesterdays late move up and top doji marked end of 1:1 move.
 

Attachments

  • untitled.GIF
    untitled.GIF
    65.8 KB · Views: 267
Wed June 2nd

very informative day.

I am attaching 2 min action and a tick chart without any comments on it. Don't ask me why now :LOL: - I will come back to it in a bit.

I was asked why volume patterns A-B and C-D - SEEMINGLY identical - caused such opposite price actions.

This is an important point. Let us analyse it.

let us first see underwhat circumstances the volume spike at 11:30 (A-B) emerged.

Beginning of day - longs from yesterday r happy to take advantage of the slight gap up and close at a profit - given Intel's performance, the futures operators keeping a close eye on cash operators on an Intel-flavoured day :LOL: . 10:04 - bears initiate short positions, but look at btwn that 10:04 down spike and about 10:40 - bulls fight back, the volume is not stellar, but definitely steadily not light. By 10:40 price-volume picture is clear - bulls almost re-gained the field they lost on that 10:04 wave of selling. BUT volume dries up - bulls r not charging any further (futures operators are wary of INTC cash piture).

Bears stage a comeback - look at that PARABOLIC increase of volume into 11:30 bar. This parabolic feature is mega-important in volume analysis IMO. But what ground do they conquer? 2 points. Now look carefully at 2 price bars round 10:30, red one down, then a maribozu straight back up losing HIGHER than the previous bar ON THE SAME VOLUME LEVEL. What is that? only one thing - FULL SHORT COVERING.

Yes of coz the belated small money crowd manages to retest the ES low of 11:30 at 11:50 on much smaller volume - where bigger money happily picks it up :LOL:

Now look at C-D sequence. SEEMINGLY, ONLY SEEMINGLY THE SAME!!! Volume dynamics is TOTALLY different at the bottom of things. PARABOLIC C explosion of volume from previously flat market is GENUINE LONGS taking positions. D line creates "rare air" at already elevated price (bull flag). 14:10ish - new GENUINE longs rush into this "rare air" and the price explodes to the upside.

Of coz it wasnt just a coincidence that the cash operators played intraday Intel bounce off double bottom.

Now it gets really interesting and the price-volume is telling the full story.

The price gets to 1128. Now step back and assume u r a reasonable size futures operator and u r sitting on >50 biggies from 1121. What do u reasonably do? U sell 1/4-1/3 of your exposure to pick it up 2-3 points lower. That creates a "bull mousetrap" where smaller money starts shorting essentially playing into big fish hands. Well played btwn 14:50 - 15:10 ish, and the big boys bought their 1/3 back at 2-3 pts lower.

actually the mrkt is ready to rock'n'roll. But new bulls must come into play.

They don't. WHY? Eyes on cash operators. At 15;14 massive unwinding of intraday long INTC positions - look at INTC volume spike on the 3rd LOWER TOP!!!! Those longs are happy to jump out even without waiting for Intel re-testing the first highest top.

This stops new bulls from coming in on the futures. MOREOVER, those happy lads who just bought their 1/3 back are now more concerned. It is not fine tuning of daily P/L any more :LOL: and they sell 1/2-2/3 or their exposure. We get line E on volume which has all the trademarks of a PARABOLIC explosion. BUT - by 15:36 volume just fades off. The parabolic explosion DID NOT DELIVER any significant volume spike.

What is it telling us? Yes the big wigs sold 1/2 of their long exposure - but firmly kept the other half! :!:

AFTER ALL, a 50% Fib retraement of the previous move is EXACTLY THAT - losing 50% of exposure to lock into profit and keeping the other half!!!!

NOW WHAT DOES TICK HAVE TO DO WITH IT???? ;)

i said many times on these threads that a particular value of tick, -356 or +287 :) is meaningless without the context of price action. However, look at Tick's 2 ma (blue line on Tick chart) at 11:30 and 13:30 volume spikes. What is different?

11:30 - volume spike at Tick average at 0.
13:30 - volume spike at Tick average at 500+

Think about Tick definition for a sec. It is also sort of a "volume" reading innit? How can u have Tick at 0 when the volume spikes up? Only one way - every downtick gets picked up => volume spike at 11;30 is definitely SHORT COVERING, not GENUINE LONGS. On the contrary, a volume spike at 13:30 with Tick at +500 plus, is definitely GENUINE LONGS BANGING IN!!!!

i annot believe it took me 5+ yrs to start seeing things so clearly..... darksiders, I am not just thanking u, I am bowing here :LOL:
 

Attachments

  • CME-ES04M- 2 minute.jpg
    CME-ES04M- 2 minute.jpg
    60.4 KB · Views: 382
  • Nyse Issues Up&down Ratio- 5 minute.jpg
    Nyse Issues Up&down Ratio- 5 minute.jpg
    33.1 KB · Views: 328
china white said:
very informative day

Of coz it wasnt just a coincidence that the cash operators played intraday Intel bounce off double bottom.

Now it gets really interesting and the price-volume is telling the full story.

The price gets to 1128. Now step back and assume u r a reasonable size futures operator and u r sitting on >50 biggies from 1121. What do u reasonably do? U sell 1/4-1/3 of your exposure to pick it up 2-3 points lower. That creates a "bull mousetrap" where smaller money starts shorting essentially playing into big fish hands. Well played btwn 14:50 - 15:10 ish, and the big boys bought their 1/3 back at 2-3 pts lower.

actually the mrkt is ready to rock'n'roll. But new bulls must come into play.

They don't. WHY? Eyes on cash operators. At 15;14 massive unwinding of intraday long INTC positions - look at INTC volume spike on the 3rd LOWER TOP!!!! Those longs are happy to jump out even without waiting for Intel re-testing the first highest top.

This stops new bulls from coming in on the futures. MOREOVER, those happy lads who just bought their 1/3 back are now more concerned. It is not fine tuning of daily P/L any more :LOL: and they sell 1/2-2/3 or their exposure. We get line E on volume which has all the trademarks of a PARABOLIC explosion. BUT - by 15:36 volume just fades off. The parabolic explosion DID NOT DELIVER any significant volume spike.

What is it telling us? Yes the big wigs sold 1/2 of their long exposure - but firmly kept the other half! :!:


China that 's the key !
 
Hi china white, SOCRATES,

Yet more excellent posts. Thanks really for all your effort.

Thanks frugi :eek: . There is still a long way to go for me, and I would like to continue the journey. :)

frugi said:
Socrates said "This is an example, a classic example in which an ambush mounted does not succeed on the first attempt, but a tiny drop lower leads to success."

Forgive me for so rudely butting in folks, but I don't understand what Socrates meant by "the first attempt". Surely the one and only ambush is the tiny drop lower, a gunning of the stops that were placed too obviously and timidly a mere tick below the low of the previous three bars?

Lovely trade by the way clylbw. I wish I could manage the transition from nephelokokkygia to trading terra firma as swiftly and competently as you clearly have. But with threads of this quality failure is slowly becoming an option I might just be able to forgo.

The air in the dark chamber may be rarefied, but the molecules sure smell sweet.

Thank you all, as ever.
 
Finirama said:
2 simply trades 2day.

Short just before open figuring it would be end of wave 5 and closed and reversed at bar 3. (10 min chart)

To tell the truth, i personally wouldn't have needed to use volume to have made these trades and would have traded these just on pattern formation, but must add that the volume did give me extra confidence in the decisions.

Decreasing volume on the move down, displaying disinterest to take the price lower. Selling volume drys up on bar 3 (lowest volume bar) with tweezer bottom bar 4 (on higher volume) confirming the unwillingness to close lower than the open of bar 1, which acts as support (also on modest volume). So long on bar 3 with stop just below bar 1.
####################################################
Sold on doji bar 5 which had the highest volume (uptil then) showing strong resistance to take it higher.
####################################################

That 's right Fini, always sell on a rise, very good, well done !
 
Hi SOCRATES,

I take it that you watched INTC today alongside the futures? May I ask whether you do this systematically, i.e. watching the heavy-weight stocks alongside futures, or whether you do it on special days e.g. when there is surprising news?

Currently I only watch the futures without paying attention to individual stocks. Is it better to watch the stocks too?

Thanks really. :)
 
clylbw said:
Hi SOCRATES,

I take it that you watched INTC today alongside the futures? May I ask whether you do this systematically, i.e. watching the heavy-weight stocks alongside futures, or whether you do it on special days e.g. when there is surprising news?

Currently I only watch the futures without paying attention to individual stocks. Is it better to watch the stocks too?

Thanks really. :)

You must. I will expand on this.
 
Top