My trading strat.......

Just an update for me......

Still doing well with this set up on the S&P emini.

Yesterday was a shocker for me. Broke all the rules, was just totally out of sinc. Did manage to claw some back towards the end of my day so I ended 1.75 points down.

Totaly was much better. Totally focused on sticking to my plan. Even caught myself before I could jump in and chase the market on one trade. By doing so I got in the trade at a much better price once everything lined up.

Ended today with 3.75 points.

Averaging 3-4 points a day most days, trading for an average of 2 hours a day.

Cheers,
PKFFW
 
Hi Guys,

Just to confirm I run 2 lots. One out @ +10, Second as a runner. Will exit as soon as system changes or a recent relative low/high gives way. Where there is an upside there is a downside. I believe running 2 lots to be extremely benficial, you will find a lot of people who wouldn't agree with this. The downside is that losses are effectively doubled if you get it wrong.

I trade with another guy who runs 3 lots. However, when starting I would progress slowly, remember it might look good, but always study the downside. If it goes wrong three losing positions to manage versus one....this means a lot more pain !

Had a good day today...looking forward to more tomorrow !

Good luck guys

Mark
 
Just an update for me......

Still doing well with this set up on the S&P emini.

Yesterday was a shocker for me. Broke all the rules, was just totally out of sinc. Did manage to claw some back towards the end of my day so I ended 1.75 points down.

Totaly was much better. Totally focused on sticking to my plan. Even caught myself before I could jump in and chase the market on one trade. By doing so I got in the trade at a much better price once everything lined up.

Ended today with 3.75 points.

Averaging 3-4 points a day most days, trading for an average of 2 hours a day.

Cheers,
PKFFW

Yesterday was very dodgy. Choppy action very tough. Made 15 points in the morning on FTSE and shut up shop for the rest of the day. Was looking at a Dow 5 minute through sheer boredom...that was working a dream pre the FOMC decision !

Glad you are enjoying some success.

When it is in a range I wait for the price to break through and trade this direction. Trading in a range will lead to losses IMO
 
A sure fire rule

:cheesy:
Lesson to remember - difference between spiking candle and one sided volume candle. Got it. Thanks Scott

There is one thing on markets that you can be sure of, that is..... change, things aren't always what they seem.

Regarding software, ABN is great software for this strat... I also miss not having volume indicators. I think that is due to the fact that CFD's and spreadbetting prices are not the real thing. If I can build up my capital by trading, (if I don't go broke first) I would then go to TradeStation securities to trade real futures. I know they have volume indic..s and I also know a scalper trader who is doing very well with them. So the software must be excellent. I have tryed IB demo - a shocking platform in my opinion.

I think were going a bit off track here, I don't want to wreak this thread. So lets PM anything out side of the strategy from now on, or we could go to an other tread if thats ok with you.
 
:cheesy:

There is one thing on markets that you can be sure of, that is..... change, things aren't always what they seem.

Regarding software, ABN is great software for this strat... I also miss not having volume indicators. I think that is due to the fact that CFD's and spreadbetting prices are not the real thing. If I can build up my capital by trading, (if I don't go broke first) I would then go to TradeStation securities to trade real futures. I know they have volume indic..s and I also know a scalper trader who is doing very well with them. So the software must be excellent. I have tryed IB demo - a shocking platform in my opinion.

I think were going a bit off track here, I don't want to wreak this thread. So lets PM anything out side of the strategy from now on, or we could go to an other tread if thats ok with you.

Yes, I was going off thread. Sorry about that. ;)
 
Yesterday I traded long on the Dax in early am. The first made a few points and I moved the stop to BE. I got stopped very quickly but I was out with no loss. After a while I had to buy back in at a higher price but made 38 points in the prelunch session. The point is that if I had stayed in the first trade I would have, eventually, won more. But how was I to know that? I was not prepared to look at my loss accummulating. I was better off out of the trade, I had a cup of tea and waited for the next move.

Split

hi splitlink,

i hear what you are saying. if the move is with the trend and it still looks good, it is okay to re-enter if one has a tight stop. so getting stopped out or raising to BE quickly is okay. i feel i can breathe much easier when my stop has moved to BE. very tricky to find the right balance for me at the moment. but i'm getting there, slowly.

regards
 
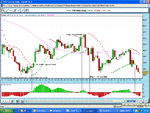
Please could someone have a look at this chart for this morning so far and let me know if the entries/exits stack up?...i'm assuming the sma(50) acts as a directional filter...

Ceydababy, many thanks for sharing your work :cool:

Cheers
Simon
 

Attachments

  • 1min MACD PSAR 13th Dec 07.GIF
    1min MACD PSAR 13th Dec 07.GIF
    60.7 KB · Views: 354
Please could someone have a look at this chart for this morning so far and let me know if the entries/exits stack up?...i'm assuming the sma(50) acts as a directional filter...

Ceydababy, many thanks for sharing your work :cool:

Cheers
Simon

hi,

They look stacked up to me. I only took the first long signal this morning. Although it is below the moving averages, if figured that it might be good because of the gap down. So I suppose I faded the gap and got closed out at +10.

I haven't entered any more trades yet because of the out-of-sync period. The next entry you point out were in the out-sync period. The short signal you point out seemed to turn out okay, but I would have got stopped out quick at -5.

The short at he end on your chart, turns out it was a good one, but I was unsure if things were back in sync or not. But I would ordinarily be looking for the MAs as a filter. If I feel hesitant then I am staying out.

I am looking at higher-timeframes for main trend direction and then using the 1m chart for an entry.

cheers, :D
 
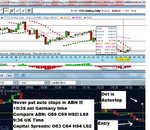
Ripped off by Autostops FACT

A word of warning for anyone with a trading account.
DO NOT PROGRAM STOPS UNLESS THEY ARE FAR FAR away!

This is a very good eg. of what happens.

THIS STOP WAS 10 points away.

RIPPED OFF.jpg

Capital spread charts above showing OCHL of 9:36 UK 1 min charts / ABN below German time showing fill by with there own built in stop icon on chart.

USE this photo and spread the word around.
 
Last edited:
I haven't entered any more trades yet because of the out-of-sync period.

I am looking at higher-timeframes for main trend direction and then using the 1m chart for an entry.

cheers, :D

Thanks Gorney,

Could you expand on how you determine an out-of-sync period?

The higher TF idea is a good one...i'm also considering just using the directional bias of the 7am-8am period, to give the trade direction for entries between 8am-11am.
 
directional bias

Thanks Gorney,

Could you expand on how you determine an out-of-sync period?

The higher TF idea is a good one...i'm also considering just using the directional bias of the 7am-8am period, to give the trade direction for entries between 8am-11am.

hi,

Very interesting idea. Going with the direction this morning, the shorting has definitely paid off. I managed to take the last one as well. Feel more confident going with general direction of the flow.

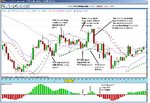
Maybe somebody else could explain the out-of-syn periods better. But here I will try to explain as I understand it. Its when the MACDH/SAR gives a long signal at top of short move up, just as price heads down. Or the when it signals short at the bottom, just as it heads up. They seem to get whacked out on short moves up and down in price, such as happens in small ranges, either sideways or gradually higher/lower. Also a sudden wide candle, signalling a change in the SAR colour can knock it out of sync.

I don't know if that helps. :confused:

I don't recommend taking any of these contrarian out-of-sync trades with real money. I would hate it for anyone to lose money because of something I said. But I am looking at trying to develop some sort of system to identify and get in on some of these trades. I think an extremely tight stop loss would help cut the risk just in case one gets it completly wrong.

I send a chart for visuals.

Scott

p.s. the first two changes in the SAR i indicate on the chart would not have been a buy/sell signal anyway, so could have been ignored, but maybe they could have been a warning of out of sync buy/sell signals approaching.

The two 'proper' buy/sell signals with MACD changing in line with the SAR would have been out-of-sync. These are what I am looking at making into a contrarian strategy for this system.
 

Attachments

  • out of sync.JPG
    out of sync.JPG
    147.9 KB · Views: 341
Last edited:
I saw it too!

A word of warning for anyone with a trading account.
DO NOT PROGRAM STOPS UNLESS THEY ARE FAR FAR away!

This is a very good eg. of what happens.

THIS STOP WAS 10 points away.

View attachment 31773

Capital spread charts above showing OCHL of 9:36 UK 1 min charts / ABN below German time showing fill by with there own built in stop icon on chart.

USE this photo and spread the word around.

Argh! :devilish:

I saw it too. Not the first time. There was another massive spike on ABN that didn't occur on capital spreads chart.

Not good :(
 
Thanks Gorney,

Could you expand on how you determine an out-of-sync period?

The higher TF idea is a good one...i'm also considering just using the directional bias of the 7am-8am period, to give the trade direction for entries between 8am-11am.

Hello,

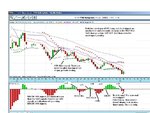
This is more on the out-of-sync periods i've been looking at.

This is on a 5m chart and is easier to see than the 1m chart. I'm just finding it very curious and interesting. If I can develop a strategy with it and demo it first then I might well be onto something.

Tell me what you think. Be brutal if you like! :p

cheers,
Scott

oops! forgot the chart. here it is!
 

Attachments

  • out of sync 2.JPG
    out of sync 2.JPG
    133.4 KB · Views: 327
This is on a 5m chart and is easier to see than the 1m chart. I'm just finding it very curious and interesting. If I can develop a strategy with it and demo it first then I might well be onto something.

Tell me what you think. Be brutal if you like! :p

...you could well be onto something, contrarian MACD-H signals can be very useful, I use one on a 4hr EUR/USD strat. Good luck with the testing :)

For this strat, i'm erring towards using trend bias from the opening range coupled with the slope of the sma(50); i'll want the ma slope to be in agreement....i need to batten down the exit plan now.
 
Going with the trend

...you could well be onto something, contrarian MACD-H signals can be very useful, I use one on a 4hr EUR/USD strat. Good luck with the testing :)

For this strat, i'm erring towards using trend bias from the opening range coupled with the slope of the sma(50); i'll want the ma slope to be in agreement....i need to batten down the exit plan now.

Thanks Chow,

I've not heard of the contrarian MACD-H signals before. Not until I started seeing them for real. Your system sounds interesting. But I won't be nosy. ;)

Based on today's action, i agree with you entirely about taking the trade in the direction of the 50SMA, and the slope in agreement. Folk taking the short signals today, even after 11am, would have done tremendously. You got it spot on.

cheers,
Scott

Scott,

looks interesting. I assume when the signals are out of sync you are just going short on the 2nd histo bar instead of going long. Are there any other criteria you are using ? or just the bars are out of sync so I will hit the market the opposite way ?

+48.6 for the day. Stupidly decided not to trade after midday. Plenty of opps this pm.
 
oops! forgot the chart. here it is!

Hi I compared your Capital Spreads chart with my Updata chart and there were some differences - notabley that not all the SAR reverses showed on mine and where they didn't the candles were different. I asked Capital how they contstruct their charts and for anyone that is interested this is their reply:-
========
Thank you for your email. Our charts show our Live streamed Bid prices and therefore they will differ to charts from other sources.


Please see the information below about how we derive our FX prices:

We subscribe to a data feed which gives us the best bid and offer in the market from several major banks in any given currency pair. The best bid might be from one bank, and the best ask might be from another bank. We take the best of each (i.e. the highest bid and the lowest offer) and put our spread (which remains fixed) around this spread.

=======
 
Maybe somebody else could explain the out-of-syn periods better. But here I will try to explain as I understand it. Its when the MACDH/SAR gives a long signal at top of short move up, just as price heads down. Or the when it signals short at the bottom, just as it heads up. They seem to get whacked out on short moves up and down in price, such as happens in small ranges, either sideways or gradually higher/lower. Also a sudden wide candle, signalling a change in the SAR colour can knock it out of sync.

I am very new to trading and the range of indicators on charts, so may be missing the point here - but is it connected to the fact that MACD and SAR are based on what has already happened, and so can never be wholly reliable guides to what is about to happen?

I am fairly new to trading and have meddled a little with this system using mainly 1 minute charts, but looking at 5 minutes to gauge the trend. Often, even on 1 min. chart, by the time 3 MACD and SAR indicators have lined up together in a new direction, a good proportion of an initial move has already passed. This is not surprising if the MACD is some sort of indicator of (past) momentum.

Also if one looks at charts on different time-scales, then often you get different positions of MACD and SAR in the different time-frames.

Perhaps the point of the system is not that following it guarantees a profitable trade - more that trading when theses signals do not line up may be more likely to result in a loss.

And of course one is trading solely on technicals here - and the market responds to other factors too. I have been following Tony Juste's weblog for comments on forex at fxstreet.com - very highly recommended, have not checked this forum's rules to see if I can post URLs here so I won't. Interesting to see a guy who really knows his stuff on the technicals occasionally bemused or irritated when the market, e.g. GBP/USD sometimes over the past 2 weeks, is not doing what it is supposed to technically!

None of this is a criticism of the system, just an observation. Thanks to those who have publicised the system for us all.
 
I concur

I am very new to trading and the range of indicators on charts, so may be missing the point here - but is it connected to the fact that MACD and SAR are based on what has already happened, and so can never be wholly reliable guides to what is about to happen?

I am fairly new to trading and have meddled a little with this system using mainly 1 minute charts, but looking at 5 minutes to gauge the trend. Often, even on 1 min. chart, by the time 3 MACD and SAR indicators have lined up together in a new direction, a good proportion of an initial move has already passed. This is not surprising if the MACD is some sort of indicator of (past) momentum.

Also if one looks at charts on different time-scales, then often you get different positions of MACD and SAR in the different time-frames.

Perhaps the point of the system is not that following it guarantees a profitable trade - more that trading when theses signals do not line up may be more likely to result in a loss.

And of course one is trading solely on technicals here - and the market responds to other factors too. I have been following Tony Juste's weblog for comments on forex at fxstreet.com - very highly recommended, have not checked this forum's rules to see if I can post URLs here so I won't. Interesting to see a guy who really knows his stuff on the technicals occasionally bemused or irritated when the market, e.g. GBP/USD sometimes over the past 2 weeks, is not doing what it is supposed to technically!

None of this is a criticism of the system, just an observation. Thanks to those who have publicised the system for us all.

hi,

I concur with what you say on all counts.

I don't know of any indicators that can predict future price moves with any reliability.
No guarantees ever. Just stacking up the probabilities in ones favour of a successful outcome. One is not looking for perfection, just making the most of the system and trying to identify higher probability trades.

I think being able to spot when not to take signals from this system is most important. Thats probably why I was so interested when the MACDH/PSAR gave off very dodgy signals. From what i've read they are notoriously bad in ranging market conditions. Also, the lower timeframes, especially 1m, give off so much noise.

You are correct that most of the time the signals from this very simple system do not line up on different time frames. However!! I have one for you today! It lined up almost perfectly on 1m, 2m, 3m and 15m! (on the FTSE future Capital Spreads) I didn't take the trade unfortunately because I didn't notice this until afterwards. It happened at 10:17am on the 1m, 10:18 on 2m, 10:18 on 3m, and 10:15 (1st red bar) on 15m.

I didn't place my first trade until 11:14 on the 1m. It seemed high probability because shorting seemed to be with the flow of trend today. Price was below moving averages heading down on higher timeframes, the MACD signal line was below 0 and heading down. This was no guarantee which is why i place the small stop loss. It was just a trade that, to me, in my limited experience, seemed to have good probabilities of success. I know that with every trade anything can happen. But it gave me +14.70 profit. I had to wait over 3 hours to get it. But i got it. And now I can close shop for the day! :D

I concur on you final point, thanks to ceydababy for sharing this system with us. Its changed my daytrading experience for the better. A simple system that i'm managing okay with so far.

happy trading,
Scott
 
Top