Nice little bit of action there.
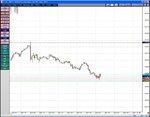
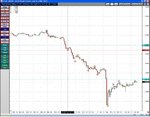
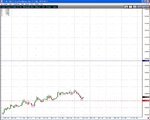
The Euro broke down fairly violently and unfortunately I didn't manage to get a good entry on it so I let the trade go. I never like to chase a trade and I was just a little late so decided to leave it. I did the same thing last week as I posted and it worked in my favor as the trade would of been stopped out this week it would of hit targets nicely so it was a shame but it's all swings and roundabouts.
The GBP however was a different story and I caught a nice piece of the Pie. I know I'm posting this after the event so it's very easy to look like I'm trading with hindsight but it obviously takes me a little while to write up the trade as well as post it and also my first priority is my own trades. But I did take this trade and I hope that you can see from the setups that I have been posting that it all adds up.
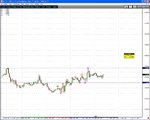
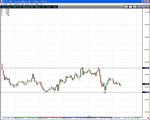
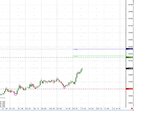
So again I'm establishing a market bias, in this case from the hourly chart as I'm only looking for a cheeky scalp, if you have longer term objectives you would use longer term charts.
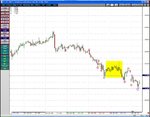
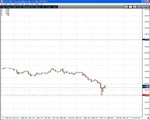
The red circles marking off lower lows and lower highs showing a down trend. There was a little point where things looked like they could turn around (marked in yellow box) on Friday morning which actually pushed me long at one point but sitting down this morning the direction was still down. I marked off the previous swing high and swing low and was waiting for a break. This isn't to say that things were massively range bound its just what I was using as a reference to trigger my trades. A break to a new swing low shows the downtrend is still going and a break to a new swing high could suggest a change in direction.
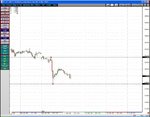
Price moves to the downside making a new lower low which for me means there is still further downside potential. Market action for me is therefore bearish so I drop to a lower time frame to find my short entry based on price action.
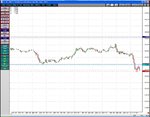
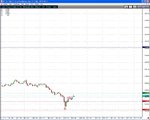
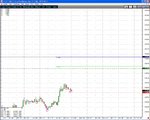
I took the breakout low (red circle) -2 and round down to give me an entry of 1.5070 (red line) My stop is placed above the pull back high +2 and round up to 1.5095 (light blue line) and as the chart shows the order triggered and rapidly sold off.
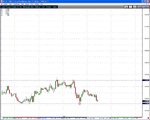
Price continues to make lower lows and lower highs (red circles) selling off nice untill we get a higher low, higher high (Pink circles) this is showing there is a chance price could turn around and so I manage my stop to the top of the higher high + 2 and round up to 1.4915 (second blue line) which for me has just been stopped out. So a nice 155 ticks
😱 (thanks for that David) on the trade.
I hope that has all come out ok as I have tried to power through it so if there are any mistakes please let me know.
Thanks
Pozzy.