my journal 2

Status
Not open for further replies.
ruminating all day...

http://www.thefreedictionary.com/ruminating

The past keeps haunting me. I keep thinking over and over about past abuses by my dad (emotional) and by other people. I feel abused even by the maid. On the other hand I am afraid of abusing others, because I've been raised to "show the other cheek"... so I end up getting abused in order to avoid abusing others. Yeah, because there is a very thin line between one and the other.

For example that slut, the maid, she won't even buy milk for me before it runs out, but I don't want to treat her like an idiot and tell her when to buy it, bossing her around. But then I end up feeling abused.
 
sad

Back at work. Mood: sad. A goddamn whistling idiot going down the hallway just made me switch to pissed off mood for a few seconds. Now back to sad.
 
creating a system on daily pivots

Continuing from here:
http://www.trade2win.com/boards/trading-journals/86996-deadline-june-33.html#post1214266

Step 1: I got the data from IB and customised it (see attachments). Now I need to set it up on tradestation and get the pivot lines to be the same as on IB's chart. I might have to do this another time, because I found a new bug on the existing systems to be taken care of. But I'll definitely get done with this before the end of the month.
 

Attachments

  • from_IB_to_TS.zip
    118.4 KB · Views: 95
pivot system

Ok, I've almost completely solved the bug on the other systems, and soon I'll move on to the next step: setting up IB's data on tradestation.

I need to take it one step at a time or I'll be overwhelmed by this task.

Ok, I set up the data fine. It takes the same exact settings as the DiskTrading 15 minute timeframe data.

Now let's see what pivots IB uses:
http://www.mypivots.com/articles/articles.aspx?artnum=36

Ok, they use the classic formula, and it matches it perfectly, and these are the pivot lines I will focus on (quoting from link above):

PP = (HIGH + LOW + CLOSE) / 3
S1 = (2 * PP) - HIGH
R1 = (2 * PP) - LOW

I only focus on these because i perceive them as the most frequent and profitable. The others it doesn't bounce as much or if it does it's not as predictable, because it will go through or something like that. These are the most known probably and probably that's why they seem to work better. Also, I choose them because I have to keep things simple.

Now I need to draw them and write them in easylanguage and take one last look to see if they match.

Ok, I found a previous indicator and have modified it to suit my needs (see attachment):
View attachment PIVOT_INDICATOR_SIMPLIFIED.ELA

Ok, I've applied the indicator and now we need to find out if they match precisely (they should):

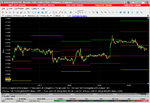
IB looks like this (for the last few days):

IB.jpg


Tradestation looks like this (I've only drawn PP, R1, S1):

tradestation.jpg


I told you it was a matter of surgical precision! They don't match at all. The days start at a different time on tradestation. On TWS the day starts at 17 CST which is midnight in GMT. On mine the day starts at midnight like it always does on tradestation. Just TWS can decide to start the day at 17 local time, but I cannot do the same on tradestation.

Another problem is that the chart shows one hour ahead of what the downloaded data shows, so no matter what I am always one hour off, but this is the smallest problem.

Ok, damn.

I am stuck. This is a huge problem. I checked and the only way I can download the data is in the wrong format. It's going to take me weeks of googling in order to find out how to offset the time settings on Tradestation or how to... basically just because of the time settings I cannot finish testing this nightmare of a pivot system.

I momentarily have to give up.

Ok, one last summary of the problem, before quitting, so I can resume later.

What on my tradestation chart is 9.30, becomes 10.30 on the TWS chart, but this derives from the fact that if you download the data from TWS, what shows on the chart as 10.30 is actually 9.30 on the data - which sucks big time to begin with. They have the chart in EST and they give you the data in CST. There is no download mode (button, code, etc.) - I checked it - which will solve this problem.

Then, as if this weren't enough, their "chart day" ends at 17.00 (US Eastern Time, I can tell by looking at it now) and pivots depend on that, because new pivots are drawn at the end of their "day", or rather at the end of their "trading session".

On their data the day instead ends at 16.00 (which is obviously US CST, because it's one hour less), and that is also the time new pivot lines should be drawn on my chart. But this cannot happen because on tradestation the day ends "inevitably" at midnight (I'll have to google for one month to solve this).


SUMMARY OF PROBLEM IN TWO LINES

So I guess the problem is only one now: I don't have to worry anymore about getting IB's data to agree with TWS' charts. I only have to get Tradestation to start the new day - not at midnight - but at 16.00.


MORE PICS TO EXPLAIN

As the pic clearly shows IB TWS' chart starts the new day at 17.15, after taking a 15 minute break from the previous session:

IB_TWS_CHART_new_day.jpg


As this other pic shows, if you ask the same TWS for data, it returns you a whole different session, ending one hour earlier, which only means it's measured in CST:

IB_TWS_DATA_new_day.jpg


But now that I am thinking of it, I have my computer set to CST so maybe that is the cause of the problem. Let me check. Otherwise i just have to find a way to tell tradestation to start the day when that 15 minute break occurs.

Ok, now I am on Central European Time. Let's see what happens to TWS and its data. Nothing will happen to tradestation for sure. It doesn't give a **** about what time it is on my computer. It only cares what the data says. There's no live trading, it doesn't adjust anything.

TWS chart: no changes. It still takes a break between 17 and 17.15. And all pivots depend on this, Adamus. You got me into this mess now you have to get me out. I told you I wouldn't be able to solve these complex problems.

Good.

Absolutely no changes. So, no matter what the time is on my computer TWS and tradestation don't change. TWS chart is different from the data, which is bad. And tradestation won't start the day... now it's time to google this problem, and for today I stop here:

http://www.google.com/search?hl=en&...=f&aqi=&aql=&oq=&gs_rfai=&fp=8da47ac806d1c372

This is a start:
http://emini-watch.com/free-stuff/tradestation-easylanguage-code-vertical-line-time/

If I could just solve this problem, I think I could create a profitable system out of this.

Ok... solving with the Universe settings on format symbol, and have inserted the session break on the format window properties... now I just have to get the session break to coincide with the new day, because the pivots still get recalculated at midnight.

I didn't know the universe settings could be tweaked so much:

universe_settings.jpg


Mmh, I am getting closer. I think the solution of the problem is in Global Server:
global_server.jpg

Wrong. It didn't work. It's a mess, and it's hard to find help on google.

I posted the question on forums:
http://www.elitetrader.com/vb/showthread.php?s=&postid=2919674#post2919674
http://www.trade2win.com/boards/tra...n-offsetting-trading-session.html#post1214562
 
Last edited:
Re: pivot system

Don't forget, if this works you owe me a cut, since I inspired you to work on it again.
 
pivot system

I found an easy solution, all things considered (on the forums listed in my penultimate post). I will use excel to move the hours. I will keep you updated on the progress, later on.
 
Damn, I can't sleep. I've already text messaged those at work, telling them I might not go. And I still can't sleep despite the increased "serenity" caused by not worrying about going to work. About which i feel guilty anyway.

I am worried about everything, pretty much. From pivot lines to death. Can't find the proper drug to relax.

Damn...

Damn.

I am not tired enough to sleep but I am too tired to go to work, especially after taking all these extra pills trying to go back to sleep.

I have a compulsive personality, workaholic type. I was done with all work. Finished creating the 20 extra systems, which are working fine. Everything is taken care of. And what do I do? I go and read someone else's post and get the idea of creating another system. No one forced me but my own drive to improve things and myself.

But this is not good. This is like overheating your computer and burning it out. It produces more harm than good.

And as usual, I got all this from my dad. He pushed me to work harder forever. Initially I rebelled and stopped going to classes, because it was just too much pressure and even if I did well, I never received any gratifications, so it didn't seem a useful thing to work hard (i got criticized anyway) and I stopped, so at least I didn't have to work on top of being criticized.

But then, as I grew up, even just a couple of years later, I inherited my dad's compulsiveness - of course through teaching and emulation, not because it's in the genes or anything.

And so I started with my list of compulsive achievements - doing anything but having fun. So I started with reading: reading one book every three days, after a year and 100 books, I decided it was enough and moved on to... watching movies. Which I am still doing. Sometimes watching up to 5 movies in one day. Especially in my early twenties, in college i was skipping classes, and watching 5 movies a day.

But before that, i got obsessed with learning English, and then French, and then Spanish... and then it wasn't enough and i wanted to learn German but there I stopped.

Then I got obsessed with trading, and everything here happened differently - with results not linked to efforts.

In reading, if you push yourself you read more, and you "achieve" - maybe you didn't enjoy the book, but you can say you read it in 3 days. Same with movies. You can make yourself watch movies. With languages you can make yourself learn new words, by getting up in the middle of the night and looking up something in the dictionary, which I did for many years.

But with trading, you cannot make yourself trade profitably. Actually the harder you push yourself the more you trade and the more you lose. It's one of those rare things, where effort can easily be misplaced. I can't think of any other things I am familiar with where, like in trading, your efforts do not pay off. This is not the case with automated trading, and I should have focused more on it from the start, completely on it. But with discretionary trading, you get ****ed over and over again, simply by your compulsive efforts to increase your capital.

Well, there's many facets to this, but you know what I mean - I explained all the details countless times.

Hell no, since I can't sleep let's get into it.

In automated trading, things are different, because you're not there having to exercise patience. So you just hack away and create new systems.

So the problem for a workaholic and compulsive person like me is when you have to exercise patient, where a job can only be done with a certain dose of patience.

Because you cannot have patience if you're a compulsive worker - you get used to getting things done. But trading - and similar endeavours - get done by being patient and accepting that things don't get done, because they're not within your control.

So that would be like fishing, where you have to wait for the fish to come to you. Which I have never done, but probably because I would fail at it.

It would be like women, where i fail, because I wait for immediate acceptance, and if they hesitate even one minute, then I say "better nothing than waiting and incertitude". And if I succeed and get the woman, i fail soon thereafter because i try to impose my schedule on her - phone calls she has to answer when I feel like talking to her and phone calls i don't answer when she needs to talk to me. Control freak, as I wrote on my profile.

Wherever things/people are not under my control, I try to control them. In trading, romantic relationships, fishing and other things, this causes you to fail. Yet I cannot avoid it, because my desire for control is uncontrollable. This, besides having a control freak father, might also have to do with being an only child. As an only child, I didn't have a brother getting me used to things being misplaced. Where I left my things, they stayed. No one changed my order of things. Other people might give up on control early on, because they realize they cannot achieve it. I didn't, because the settings were much more favorable. An orderly father, everything tidy... no brothers. So I chased the illusion of complete control and perfection. And I still try to achieve that, constantly.

But as I said, in some fields, the constant effort of controlling causes you to fail: in fishing you're going to chase away the fish. I'd probably be checking every minute if there's fish approaching. With women I usually act like "you don't want me? fine, just give me an answer immediately". That of course is even worse in Italy where women just never throw themselves at you, like they do in the US. And with trading, you don't just come home empty handed because you didn't catch any fish. Every time you miss you're losing money besides time. You can't say like i do "now I am going to make 400 dollars because i want it". I find myself thinking stuff like "I am going to make 300 dollars from this trade", even before i start it. Not only that. If things go the wrong way, I don't get out because I had decided that i had to make 400 dollars. Then, once I am down 400 dollars, I decide that I'll be happy with getting out at breakeven - no actually I can only accept to get out at a +1 dollar profit. So i can say i didn't lose. Sometimes in order to reach that 1 dollar profit i risk my whole account. Then, as soon as it happens, I get out. Of course once every ten times, with the martingale stuff I do, this makes me blow out my account.

Enough said. This was good writing but it turned into the usual whining.

 
Last edited:
pivot system

Ok, back home from work, and back to work on the pivot system.

Now I will download the data again and fix it by offsetting it as much as needed to obtain a perfect coincidence between tradestation chart and testing and TWS chart and trading.

Let's take it one step at a time or I'll be overwhelmed by the task.

1) turn tws on, paper trading account (the data should be identical): DONE
2) open up twsdde.xls to request historical data: two weeks of it: DONE
3) There's a dog barking endlessly. Hold on, I am getting my shotgun, shooting both the dog and his owner and I'll come back: DONE
4) convert the data in the proper format (first step): DONE
5) convert the data in the proper format (second step of offsetting the hours): Ok, this is where it gets hard. I basically want the 15 minute breaks be right at midnight, so the pivots will get calculated based on it. Now it takes place at 16.00, so I need to move everything ahead by 8 hours, which will result not even in CET but in Athens time. The session breaks that I am seeing now on tradestation will have to match the creation of new pivots:

session_breaks.jpg


Ready? Damn! I have good and bad news. All this work for nothing. I have just realized and double-checked and here's the news: the EUR IDEALPRO is almost identical to the CME EUR future. There's no need to be fussy here because they are they same, as they both close at 23.00 CET (16.00 CST), so the pivts get formed from the same identical prices. The only difference is that the future re-opens a bit later, but I'll ignore that difference. Whatever is offset by the fact that the future is a few ticks more or less than the forex, gets balanced by the fact that the pivot will also be offset. So from now I will have to remember that I can use Disktrading data, and test years and years of this stuff, since everything is the same. But still I will have to make sure that
1) Disktrading data is the same as IB data
2) the hours get offset so that the end of the session happens at midnight on tradestation and everything gets calculated correctly.

Now back to transforming the hours. Ready? Ok, DONE. I am uploading here the file used, for future reference:
View attachment EUR_IDEALPRO.xls

Here is the output .txt file for tradestation (from excel I saved it as .txt "tab delimited"):
View attachment EUR_IDEALPRO.txt

Now back to my little steps:
6) set up data on tradestation and see if everything matches the TWS chart: DONE

7) fix the session schedule on the universe settings to customize it so it matches: DONE ---- no, bull****. It won't take the midnight value. I cannot end the goddamn session at midnight, but must write 11.59.

Ok, here's the best I could do with the Universe Goddamn Settings:

universe_settings.jpg

This means that we're ending correctly, because even if it says 11.59 PM, it does take the right value from midnight. But I do not start correctly. Rather than at 00.30 or even 00.15, it only lets me start the session at 01.00 AM. This means I totally screw up the Open value. But guess what Pivots don't give a **** about the Open so I am ok, provided it doesn't touch the day's high or low at the open, which could happen, but rarely. It is not likely to happen in the first 30 minutes of trading, which is what I will miss.

8) Ok, now all I have left to do is to check that the pivots coincide on tradestation and TWS and then I'll have to take a break for the day, because after a day at work... also my energy is not what it used to be. So I am done for the day, and this is good enough anyway.

But first let me tell you if the pivots coincide. Let's even take a snapshot of both:

TWS:
comparison_tws.jpg

Tradestation:
comparison_tradestation.jpg

Ok, so... we have 7 days on both of them, the last 7 days. Now, I want you to ignore the green and yellow lines on TWS (first pic) because as i said i will not trade the S2 and R2 pivot lines. So on TWS only consider the central 3 lines and compare them with the 3 lines on tradestation's chart.

Ok, I've checked them thoroughly for discrepancies and this is what I call surgical precision. There is perfect correspondence.

So now I will be able to test my system by simply downloading IB's data, whether IDEALPRO forex or CME future, it won't make a difference. But for now I'll stick to IDEALPRO. Later, when I'll automate it, things will be implemented much more easily with the CME future data.
 
Last edited:
pivot system

Ok, since Adamus is reading, so I feel encouraged to continue, here's my first system. As I post it I still haven't checked if it makes money. I will comment in CAPITAL red what it does:

Code:
Inputs: test(0), test2(0), test3(0); [COLOR="red"]THESE are here for later optimizations[/COLOR]
variables: Pivot(0), Res1(0), Sup1(0);[COLOR="red"]THESE are needed to define pivot points[/COLOR]

Pivot = (HighD(1) + LowD(1) + CloseD(1))/3;[COLOR="red"]THESE are the pivot formulas[/COLOR]
Res1 = 2 * Pivot - LowD(1);
Sup1 = 2 * Pivot - HighD(1);

If marketposition = 0 and time <= 2100 and low <= Sup1 Then buy("Long") this Bar; [COLOR="red"]HERE I bet that if we go below S1 we will then rise for the rest of the day[/COLOR]
If marketposition = 0 and time <= 2100 and high >= Res1 Then sell("Short") this Bar; [COLOR="red"]HERE I bet that if we go above R1 we will then fall for the rest of the day[/COLOR]

[COLOR="red"]THESE are the exits: it exits at 2200 CET[/COLOR]
If time >= 2300 then exitlong ("L time exit") this bar;
If time >= 2300 then exitshort ("S time exit") this bar;

Let us now see what it does:

first_system.jpg

It trades almost every day, because R1 and S1 get touched almost every day.

I will not make it more complex for now, because I have to go to bed. But it is now time to see if it makes money (using two ticks of fixed costs per round-trip trade):
View attachment 20100810_pivot_system_report.XLS

This is great. It loses a lot of money. This could be simply reversed and we'd have a profitable system. But we need to think about it now, for days and days. We have to think if the things we change make sense.

Also, I need to first check if every single trade did what it was supposed to do, because now it doesn't seem the case. This part tomorrow.

Tomorrow I'll resume from this new code, which tells me exactly what the trades are doing and how they are reasoning and which revealed to me there's still something wrong with my code, which will take another whole day to solve:

Code:
Inputs: test(0), test2(0), test3(0);
variables: Pivot(0), Res1(0), Sup1(0);

Pivot = (HighD(1) + LowD(1) + CloseD(1))/3;
Res1 = 2 * Pivot - LowD(1);
Sup1 = 2 * Pivot - HighD(1);

If marketposition = 0 and time <= 2100 and low <= Sup1 Then begin
[COLOR="red"]Print(File("E:\downloads\financial_software\tradestation\EURO\mydata.txt"), date, time, Sup1:4:4);[/COLOR]
buy("Long") this Bar; end;


If marketposition = 0 and time <= 2100 and high >= Res1 Then begin
[COLOR="Red"]Print(File("E:\downloads\financial_software\tradestation\EURO\mydata.txt"), date, time, Res1:4:4);[/COLOR]
sell("Short") this Bar; end;

If time >= 2300 then exitlong ("L time exit") this bar;
If time >= 2300 then exitshort ("S time exit") this bar;
 
Last edited:
Re: pivot system

Ok, since Adamus is reading, so I feel encouraged to continue, here's my first system.

Yes but since I just took 5 tabs of acid, I'm not sure my readership is so desirable. But your charts are rabidly groovy. Do you want a starfish in your coffee? I'll get back to you when I'm not losing thousands. You know, money. That stuff with all the zeros.
 
It was good again, as all his movies I've seen so far:
http://www.watchingthatmovie.com/watch-1409-Mr-Beans-Holiday

Being the movie set in france it reminded me there was a similar French comedian, what do you call it when they don't speak, just like mr bean:
http://en.wikipedia.org/wiki/Jacques_Tati

Tati made this movie:
http://en.wikipedia.org/wiki/Les_Vacances_de_M._Hulot


Actually Mr Bean's Holiday most definitely was inspired by that, also given the title. Not just the movie probably but Mr Bean himself: both clumsy characters who cause trouble without realizing it... they both don't speak, yeah "physical comedy" as it says here:
http://en.wikipedia.org/wiki/Mr._Bean#Origins_and_influences

The name of the character was not decided after the first programme had been produced, with a number of other vegetable-influenced names, such as "Mr. Cauliflower", being explored.[8] Atkinson cited the earlier comedy character Monsieur Hulot, created by French comedian and director Jacques Tati, as an influence on the character of Mr. Bean.[9] Stylistically, Mr. Bean is also very similar to early silent films, relying purely upon physical comedy, with Mr. Bean speaking very little dialogue. This has allowed the series to be sold worldwide without any significant changes to dialogue.

Too bad there's only one online streaming movie:
http://www.watchingthatmovie.com/?&director=Jacques Tati


Anyway, I like mr bean better, for one reason or for another, even though jacques tati is more famous and came before him:

 
Last edited:
Re: pivot system

Yes but since I just took 5 tabs of acid, I'm not sure my readership is so desirable. But your charts are rabidly groovy. Do you want a starfish in your coffee? I'll get back to you when I'm not losing thousands. You know, money. That stuff with all the zeros.

How much are you losing? 2000? I heard the zeros don't count. So you're losing 2. It's not that bad.

I have solved the problem I was talking about and the present code does exactly what I want it to do. It even makes money. Only problem, not enough. I realize this will take a long time and skills and efforts to get it to be consistently profitable:

Code:
Inputs: test(0), test2(0), test3(0);
variables: Pivot(0), Res1(0), Sup1(0);

Pivot = (HighD(1) + LowD(1) + CloseD(1))/3;
Res1 = 2 * Pivot - LowD(1);
Sup1 = 2 * Pivot - HighD(1);

If marketposition = 0 and date>=1100726 and time <= 2100 and low <= Sup1 Then begin
Print(File("E:\downloads\financial_software\tradestation\EURO\mydata.txt"), date:0:0," ", time:4:0, 
"  H:", HighD(1):4:4, "  L:", LowD(1):4:4, "  C:", CloseD(1):4:4, "  S1, P, R1", Sup1:4:4, Pivot:4:4, Res1:4:4, "  low: ", low:4:4);
buy("Long") this Bar; end;


If marketposition = 0 and date>=1100726 and time <= 2100 and high >= Res1 Then begin
Print(File("E:\downloads\financial_software\tradestation\EURO\mydata.txt"), date:0:0," ", time:4:0, 
"  H:", HighD(1):4:4, "  L:", LowD(1):4:4, "  C:", CloseD(1):4:4, "  S1, P, R1", Sup1:4:4, Pivot:4:4, Res1:4:4, "  high:", high:4:4);
sell("Short") this Bar; end;

If (time >= 2300 or high >= Pivot) and barssinceentry > 0 then exitlong ("L exit") this bar;
If (time >= 2300 or low <= Pivot) and barssinceentry > 0 then exitshort ("S exit") this bar;

But finally I am back to a work of quality and precision rather than quantity. I want this last system of mine to be a precise system with a big edge, like 70% of wins. I will be obsessing about pivots in the next few weeks. Seeing pivots everywhere i look.

By the way, I am focusing on bounces - not on breakouts:

Snap2.jpg
 
Last edited:
Re: pivot system

Yeah, nice. What does it look like over 10 years of disktrading data?

I'm down £3000. Classic newbie mistake. Got too big for my boots and thought I didn't have to test my systems in simulation mode. But that was only half of it. The rest is legit losses.
 
Sorry to hear that. Automated trading is not as psychologically demanding as discretionary trading. It doesn't require the patience of waiting for the right opportunity, the alertness and attention of seizing the right opportunity, and the ability to close a losing trade. But it does require the ability to mentally accept a series of losses without interfering with your systems - something that I still cannot do. The good thing is that if you can do it, your systems will still reason as clearly as if they never lost. They will be just as confident and patient.

Regarding the pivot system, I cannot test it yet on disktrading data. I need to work on the precision of it before I can move it to a bigger scale.

Anyway I've already changed it. You see, I'll just keep working on it on the microscope two weeks at a time.

Now it only goes long off Pivot and S1 and the code is this:

Code:
Inputs: test(0), test2(0), test3(0);
variables: Pivot(0), Res1(0), Sup1(0);

Pivot = (HighD(1) + LowD(1) + CloseD(1))/3;
Res1 = 2 * Pivot - LowD(1);
Sup1 = 2 * Pivot - HighD(1);

If marketposition = 0 and date>=1100726 and time <= 2100 
and ((low <= Sup1 + 0.0020 and lowd(0) >= Sup1 - 0.0030) or (low <= Pivot+ 0.0020 and lowd(0) >= Pivot - 0.0030))
and low < AverageFC(c, 9)
Then begin
Print(File("E:\downloads\financial_software\tradestation\EURO\mydata.txt"), date:0:0," ", time:4:0, 
"  H:", HighD(1):4:4, "  L:", LowD(1):4:4, "  C:", CloseD(1):4:4, "  S1, P, R1", Sup1:4:4, Pivot:4:4, Res1:4:4, "  low: ", low:4:4);
buy("Long") this Bar; end;


If c < AverageFC(c, 9) and openpositionprofit > 0.0040 then exitlong ("MA exit") this bar;

{*** stoploss ***}
If MarketPosition <> 0 Then  
Begin 
SetStopPosition;
SetStopLoss(0.0040);
end;

Here's the snapshots of the report (usual bug appeared again and I can't export it in excel):

chart.jpg


summary.jpg


ec.jpg


I've now changed it once again and it got even better. Now the code is as follows (I can't post all the new pics because it takes too long). The concepts in red:

Code:
Inputs: test(0), test2(0), test3(0);
variables: Pivot(0), Res1(0), Sup1(0);

Pivot = (HighD(1) + LowD(1) + CloseD(1))/3;
Res1 = 2 * Pivot - LowD(1);
Sup1 = 2 * Pivot - HighD(1);

If marketposition = 0 and date>=1100726 
and time <= 2100 [COLOR="Red"]I'll test without this next, because I already dropped the intraday requirement[/COLOR]
and ((low <= Sup1 + 0.0040 and lowd(0) >= Sup1 - 0.0030) or (low <= Pivot+ 0.0040 and lowd(0) >= Pivot - 0.0030))
and low < AverageFC(c, 9) [COLOR="red"]WE WANT THE EUR TO BE ON ITS WAY DOWN TO THE SUPPORT NOT VICEVERSA[/COLOR]
and lowd(0) > lowd(1) [COLOR="Red"]THIS IS WHAT I ADDED, TO REQUIRE EUR TO BE IN AN UPTREND[/COLOR]
Then begin
Print(File("E:\downloads\financial_software\tradestation\EURO\mydata.txt"), date:0:0," ", time:4:0, 
"  H:", HighD(1):4:4, "  L:", LowD(1):4:4, "  C:", CloseD(1):4:4, "  S1, P, R1", Sup1:4:4, Pivot:4:4, Res1:4:4, "  low: ", low:4:4);
buy("Long") this Bar; end;


If c < AverageFC(c, 9) and openpositionprofit > 0.0040 then exitlong ("MA exit") this bar;
[COLOR="Red"]Next tests, I'll get rid of stoploss and do all via openpositionprofit - that way I simplify[/COLOR]


{*** stoploss ***}
If MarketPosition <> 0 Then  
Begin 
SetStopPosition;
SetStopLoss(0.0040);
end;

In prose, it goes like this:
If we happen to fall from above (that's what the moving average is there for) to the neighbourhood of Pivot line or S1, and it's before 20.00 CET (but I'll get rid of this), and today's low is more than yesterday's low, make a LONG entry.
If we happen to see a profit of more than 40 ticks and we are below the (roughly) two hours moving average (this is a trailing stop), then exit. Exit also if we see a loss of more than 40 ticks.
 
Last edited:
Status
Not open for further replies.
Top