I can't sleep, so i might as well work
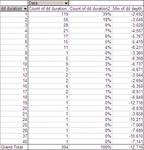
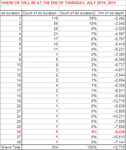
Here's what I automated: the drawdown peak-to-peak duration and peak-to-trough depth.
Here's what the self-updated sheet looks like:

Yellow-shading and red font is used to highlight those drawdowns that were already surpassed by the present drawdown: a lot of them.
I can't believe investopedia writes what it writes about the drawdown:
http://www.investopedia.com/terms/d/drawdown.asp
What Does Drawdown Mean?
The peak-to-trough decline during a specific record period of an investment, fund or commodity. A drawdown is usually quoted as the percentage between the peak and the trough.
Investopedia explains Drawdown
A drawdown is measured from the time a retrenchment begins to when a new high is reached. This method is used because a valley can't be measured until a new high occurs. Once the new high is reached, the percentage change from the old high to the smallest trough is recorded.
I either had read it before (but I don't remember it), or our logic totally matches with mine here:
http://www.trade2win.com/boards/trading-journals/85510-my-journal-2-a-244.html#post1563946
http://www.trade2win.com/boards/trading-journals/85510-my-journal-2-a-271.html#post1626214
My laptop is breathing heavier and heavier. What is he trying to tell me? He doesn't talk much.
Or maybe our logic is wrong (both mine and investopedia's). I mean there's an evident divergence between measuring the drawdown's depth with peak-to-trough and the drawdown's duration with peak-to-peak.
I know it's the commonly accepted method, so I'll keep doing it. But if we measure the drawdown as peak-to-trough, which is only normal, we should do the same for the duration, which should mean how many trading days it took the equity line to reach the distance between the peak to the valley. Yes, ok: we can't measure the days until the new high is reached. Fine. But we still should count the days between peak and trough. This is illogical that we're not doing it this way.
It would be as if I measured a trip's duration in terms of round trip -- that's exactly how wrong it is -- but its distance in terms of one-way trip. It is as if they asked me: "How long did it take you to go from Rome to New York?", and instead of replying the time it took me to reach New York from Rome, I told them the time it took me to go to New York, stay there a few days, and then come back. You see, the drawdown is the trip to New York -- that's what it is. A trip to the valley, a trip to the trough. And then they ask you how long was the trip, and you should interpret it as "the trip... to New York", but it is indeed true that we sometimes interpret it as the whole duration of the vacation. So... after all, it is illogical, it is not a scientifically coherent way of interpreting it and defining it, but it is pretty widely spread as well to interpret the "trip" to a place as the time to go there and come back. But it's not the immediate logical interpretation. It just derives from the fact that we need to come back to call our "trip" finished. "How long was your vacation", in a way. In a way it means "how long was your systems' vacation?". My systems are taking a break right now, a break from making money, or rather, a break from being profitable.
"How long was the drawdown? and "how long was your trip to new york?" question should be replied to with another question, which is "how long was the trip to the valley or to the valley and back to the top?" and "how long was my trip to new york or to new york and back home?". I would guess that the people interpreting "trip to new york" as "to new york and back" would also interpret (if they knew the subject) "how long was the drawdown?" as a peak-to-peak measurement. I don't know which group I belong to, because I was heavily influenced by the backers. I remember: initially I was reluctant to accept their interpretation, and I thought the "trip to new york" was the 8 hours it takes me to fly from rome to new york and nothing but. You see, it's useless to be fussy and pedantic... after hours and hours of posts about this, it's still unclear. Less unclear but still unclear. There's no academic, except maybe a philosopher, or my father, capable of putting the final seal on a way to interpret this. Or maybe some reader, too, might be so logical and intelligent as to give a clear and final definition, and explain it. My opinion right now is that the financial community that counts (not the large majority of newbies) interprets its depth as peak-to-trough and duration as peak-to-peak, so it should be done that way. But i still think that the newbies instead are right, and that this method of interpreting it is illogical.
So I think that for once the minority is wrong and the majority is right.
You might have thought that i was done, but i will keep on searching on this.
Oh, ****, I found the wikipedia guys. These guys are like academics:
http://en.wikipedia.org/wiki/Drawdown_(economics)
But they use a long formula, so I am lost by definition, because I am dumb with formulas. I get scared and stop thinking when I see one.
The non-formula part says:
The Drawdown is the measure of the decline from a historical peak in some variable (typically the cumulative profit or total open equity of a financial trading strategy).
So they're saying that typically by "drawdown" we refer to the depth concept. And I agree. That's what the term suggests: draw + down. Otherwise it would be "draw down & up".
Ok, this is good:
http://www.martialcapital.com/what-is-a-drawdown.php
A drawdown is measured as the percentage drop in a fund or portfolio from the top to the bottom of a negative swing. Drawdowns can only be calculated when the price finally recovers; if you don't wait until then to measure it, you don't really know if the drawdown is finished.
This is a graph of the TSX (Toronto Stock Exchange Composite index) from January 1989 to December 2006, the period of the backtest of our Canadian Equity Fund. The TSX reached an all-time high on September 1, 2000 of 11,389. It then dropped, with minor rallies along the way, to a low of 5,695 on October 9, 2002, a drop of 49.99%. The drawdown ended on January 3, 2006 when the TSX finally rose above 11,389. The drawdown lasted more than 5 years from the first drop to full recovery and at its low point had lost 49.99% of its value.
Once again, they say that depth is measured of course as peak-to-trough and instead duration is measured as peak-to-peak. Once again, it is not logical, but it is widespread among the cultured investors. The ignorant ones don't know jack**** so I won't even quote those, because they don't get it right at all and don't know what they're talking about, regardless of the fact they might have popular web sites.
This guy knows his stuff, but I don't understand him because i am stupid:
http://forex-trading4you.blogspot.com/2009/07/drawdown-in-forex-trading.html
The drawdown is a difference between some local maximum point in your balance chart and the next following minimum point in that chart. It’s the risk amount by which your strategy can go down during a streak of losses. There are two types of drawdown that are considered to be the important properties of expert advisors (for instance, in MetaTrader platform) — absolute drawdown and maximal drawdown.
Absolute drawdown is the difference between the initial deposit and the minimal point below the deposit level during all test period. It tells you how big your loss can become compared to the initial deposit during the trading. If this value was 0 during the test, then your deposit wasn’t at risk at all.
Maximal drawdown is the maximal difference between the local maximum extremum in your equity chart and the next local minimum extremum in your equity chart. It tells you how low your strategy can go after getting some profit. It can also be called a depth of a losing streak. Generally it’s a good idea not to trade with EAs with the maximal drawdown higher than the profit. But I don’t recommend trading even with strategies or expert advisors that have maximal drawdown at levels higher than 25% of the net profit. Mind your own risk-to-reward ratio and don’t trade with EAs that don’t comply with it.
Now you know what drawdown is and how it’s calculated in Forex trading. Unfortunately, the current version of MetaTrader 4 (Build 225), the strategy tester incorrectly calculates the drawdowns, so if you are testing your EAs, it’s better to calculate both the absolute drawdown and the maximum drawdown manually.
But he says MetaTrader 4 calculates it wrong, so that's something to consider.
This guy kind of confuses me but then he confirms the interpretation I read so far (part in red):
http://financial-education.com/2010/09/12/what-is-drawdown/
The decline in net asset value from the highest historical point. Often expressed as a percentage loss.
Individual drawdown is any losing period during an investment record.
Maximum drawdown is the largest percentage loss an investor could have realized during a period. It measures the pain an investor may feel if the loss recurs. Comparisons must be made using similar time periods, as maximum drawdown will be greater as measurement frequency interval becomes smaller. It will also be greater for a longer time series, potentially disadvantaging managers with longer track records.
Uninterrupted drawdown calculates the length and severity of an uninterrupted drop.
Recovery time or drawdown duration is the time taken to recover to the prior level.


