Message For Ftse Traders......

dow.a closer look
5 min data.10 point box size.3 reversal.
price in a downtrend .bounced off 8120 area
 
here is the chart
 

Attachments

  • dow.png
    dow.png
    12.8 KB · Views: 124
Ftse

a closer examination of the price action for the last week.
price now in a downtrend.4130 area being a major support
5 min data. 5 pt box size by 3 reversal hilo
thinking we will have a range drom 4130 to 4250 tomorrow.
any major news or earnings that could change this ..??
let us know
Hi,
I'm a returnee to these boards (and to trading) after some time away.Excuse any ristiness :)

Dentist, I have support at the fib retracement at 4148 and resistance at a trend line currently at 4180 from the top of what may be a left shoulder on the hourly chart; if it is a head and shoulders then a break of support sets a target at the recent lows on the daily chart.

jamesh...just woken up.looking at what you said later tonight
 
trendless chop still.
price rising/possibly in a minor downtrend
 

Attachments

  • trenlesschop.png
    trenlesschop.png
    48.8 KB · Views: 122
I can't see anything to get optimistic about. I've been selling into strength for months. Don't you think that above 4200 is a shorting area?

Split
 
im short 4125 ..........stop loss 4155!! but i may amend stop loss further ........

I anticipate 4050 to be next target!!.....
 
im short 4125 ..........stop loss 4155!! but i may amend stop loss further ........

I anticipate 4050 to be next target!!.....

will wait to see what happens monday, 4125 is right on a retracement line.

but if shorting 1st target 4075, 4000, then back to 3950 final target.

47158d1233416945-swingin-ftse-2009-fib.jpg
 
a confused picture still.as far as i can see
15 point box size by 1 reversal hilo data.data is eod
ok so price is in a major downtrend.however,we have an upthrust column and a new signal.the upward trendline drawn from the last low/3950 ish.column high is 4300 area.so 4325 should be the resistance/major.now ,at this point in time ,there has been no signal to go short on this chart.a break below 4120 area should do this.so,in theory we are still going up ,but we are at the point where a short signal could be given
this is not good.no clear direction.choppy market to make things more difficult
 

Attachments

  • nd.png
    nd.png
    33.6 KB · Views: 109
beware with all short trades.
a higher box size 50 by 1 hilo data.eod
price has broken the downtrend line and is in an uptrend
 

Attachments

  • beware.png
    beware.png
    39.7 KB · Views: 124
this chart really shows a lot.there is a very clearly defined support area at 4100.price has bounced off this all last week.it has held since monday 26 jan ...1pm ish
so despite all the bad news from last week ,this area held
is there likely to be worse news next week.??
this area held even though the miners needed more cash.i think this was the big news last week.banks kept the index up
you can see from the chart it was a trendless week.short the rallies and buy the bounces from 4100 area
 

Attachments

  • supportaea.png
    supportaea.png
    10 KB · Views: 128
the chart below is hourly data.16 point box size by 3 reversal
therefore 48 points from the previous box is needed to change the direction of the columns.ie 48 points in the other direction
the beauty is that you can take the column highs and lows as apotential supp and res.depending on youre data frequency then you get the major supp/res areas
so my reasoning is that 4100 has held foe nearly a week.with frequent retests.so major news will have to take palce to negate this
please feeel free to tell me i am talking rubbish
 
a few thoughts from the last chart i posted.this was intaday/hourly data
so,a minor uptrend started on approx 23 jan from 3950 region.this stalled and we went into trendless chop.the only thing we can learn is that 4100 area is the main support area.3 minor rallies stopped at 4220 area and one went to 4340 area.so these are the res area to watch next week.although the last signal was bearish.this is a choppy market and some tolerance should be given .hence,i am watching for a sgnal below 4100.ie a break below 4100 with a retrace and 4100 holding as the resistance.uneless,i see that then i will look to go long from the 4100 pivot area
please can someone let us know if there is any news next week that could break the 4100 pivot...????
many thanks
please post if you disagree
 
Last edited:
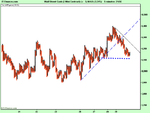
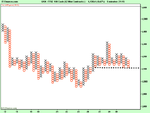
a few thoughts from the alst chart i posted.this was intaday/hourly data
so,a minor uptrend started on approx 23 jan from 3950 rea.his stalled and we went into trendless chop.the only thing we can learn is that 4100 area is the main support area.3 minor rallies stopped at 4220 area and oe went to 4340 area.so these are the res area to watch next week.although the last signal was bearish.this is a choppy market and some tolerance should be given .hence,i am watching for a sgnal below 4100.ie a break below 4100 with a retrace and 4100 holding as the resistance.uneless,i see tha then i will look to go long from the 4100 pivot area
please can someone let us know if there is any news next week that could break the 4100 pivot...????
many thanks
please post if you disagree

i think it depends what time frame you want to go for. im going to set up a series of trades next week to hedge my position. my longterm trade is short, targets 3950, 3650, 3250. im just going to trade in btw retracements...
 
I shall be shorting on Monday, when I think that I have spotted the high for the morning.

The daily chart is a puzzle, for me. Is it a pullback towards the high of 28th, or is it going to breakout upwards? I have been caught on this one so many times, so am looking at the averages for a trend clue. They are down, and the short one is below the other two.

As always, if we can catch the extremes, there are nice potential gains in either direction but, personally, I think that the probabilities are with shorting.

Split
 
Last edited:
Top