Message For Ftse Traders......

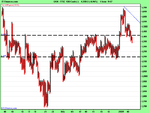
we have finally entered the decision zone.
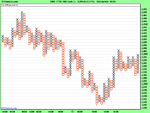
hourly daya.15 point box size.3 box reversal.hilo data
the two black horizontal lines mark that zone.notice the last 2 columns.the last "X" upthrust column stayed within the zone.in theory this zone should be where prevous resistance becomes support.so,if we get the obama effect starting next wek,then we should get the turnaround in the zone marked.there was a res area at 4300 which could turn out to be the area of support
anybody got any veiws.?
 

Attachments

  • decisionzone.png
    decisionzone.png
    14.9 KB · Views: 149
Well, at least the market didn't drop like a stone the day after I sold my option. Just thought I'd give a yell out, prove I still am breathing.

Although a cupboard did fall on me over the weekend...

Obviously, my stance is still that long term (next month or two) the market will continue downwards into the 3,000s.
 
what you guys think bout going long on energy stocks now. oil rising. market picking up slowly as well. IM thinkin going long on BG
 
what you guys think bout going long on energy stocks now. oil rising. market picking up slowly as well. IM thinkin going long on BG

I certainly wouldn't say it was a bad idea, but personally I prefer to trade in the direction of the overall market (even if I'm crazy enough to try calling top/bottom of a trend)...
 
I'll be quiet if not silent today as (a) just woken up as my daughter spent the night throwing-up and (b) I can't get any charts to display.

Ben
 
was short from last night and increased my position this morning, hit stop loss to break even. a bit annoying.
 
the 4310 area was the support today.then the bounce.we are still in the decision zone 4200-4400
 

Attachments

  • ok.png
    ok.png
    14.7 KB · Views: 122
what was the reaon for the bounce afterwards.?
i went shopping to kingston ,so missed the reversal
 
i thought i wpuld post a chart showing a reversal in p/f terms
chart is tick data.box size is 4 points.3 box reversal.ie 12 points needed to change the direction of the columns,"x" are up columns and "o" are down moves
i have put on todays reversal in the blue rectangular box
see the down columns in the box ,with the price holding at the 4315 area
then straight after we get consecutive upside breaks/double-tops.this confirms a change of direction.
the 4 point box size shows me the trend.i take the trading signals from lower box sizes
anyway,what was the reason for the strong rebversal.?
 

Attachments

  • reversal.png
    reversal.png
    15.1 KB · Views: 138
i think it was more other indices hitting their support levels bringing the ftse back up, Dow Fut 8,400, Dax 4,600...

really should have taken some profits.
 
was long energy stocks since late morning. Expecting another rally on energy stocks tomorrow. Got the oil inventory report tomorrow, and this should be lower than expected. Don't think those that were surveyed are taking into account the really cold weather in the north east of the U.S at the moment, temperatures are likely to break records, so this is definitely going to have an impact on inventories.
 
Love the charts dentist007.

The main trend was still up and there was good support at ~4,340(F). Gave a nice 3.5:1 reward:risk trade, and as I trade fixed risk/trade, it was a nice end to the day (but any day that starts with sick bowls can always get better).

I know my views are a bit simplistic, but they are doing me fine so far.

Ben
 
tripleogstar: topspreadbets.com have just sent me an email to open a march sell on bg
£10 a penny.target 800.stop at 10033.
£620 is the risk
chart basis is that price has moved down to 200 day ma of 1080.they see a decline to the bottom of price channel..the october ascending price channel.also citing ,that a slow down in profits and the declining crude price
an interveiw on radio 4.somebody saying that gas prices follow crude by 6 months
 
Top