wallstreet1928
Legendary member
- Messages
- 6,609
- Likes
- 89
Hey what do we have here .....................
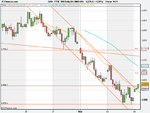
a BREAKOUT!!!
I have a breakout on 1 hr...........it concurs with my analysis last night for this major rally!!
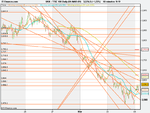
PROBLEM.........but my 10 minute chart is a bit messy but is bearish as too many resistance line!!
a BREAKOUT!!!
I have a breakout on 1 hr...........it concurs with my analysis last night for this major rally!!
PROBLEM.........but my 10 minute chart is a bit messy but is bearish as too many resistance line!!