Message For Ftse Traders......

Right I'm going to come out and say it now.

Wasn't in the right mind frame today have a lot going on in life but I was trading anyway.
Wrong thing to do. I started with £150 in my account to begin with last November ups and down then down to £50 capital left over. Then i strated trading as I would inc few silly trades and today I've just blown it. What a day.

I'm down to £2 in capital.
I'm allowed a bet size of 0.20p per point at the moment so I can do one trade with a 10point stop.
It has to be a profit trade or I'm out and don't have any funds to fund the account for a while until pay day.

My mind feels a little crammed well not relaxed but relaxed enough. Not going crazy or anything it's a learning experience and I'm still calm.

Tomtom would be nice to see how you trade. What time frames and what analysis you make of it all.
I'm going to continue trading money or no money I'll get on the simulator that some spreadbetting companies have.

How are you all doing? What capital did you all begin with if you don't mind me asking?
Any similar experiences?

Any advice, comments are welcome guys.

Viks

Hi Viks,

I only started about 4/5 weeks ago with real money. Having been patient and disciplined, I then blew nearly £300 on one trade because I forgot all the golden rules (valuable lesson though!). By the end of last week I had made £250 of that back and as of today am £50 up overall, so with patience it will come back.

Keep your chin up, and remember it's not personal! (y)

cheers
Jim
 
added to S&P short at 774.......stop loss 790!! looking for 10 point pullback

similar reason = downward trend line pierced and we could get a nice pull back

I will keep my S&P short for till tomorrow......I don't like doing it but it will prove to profitable!!
 
Right guys, I've done an analysis of support and resistence from the daily, hourly, 30min, 15min, 10min and 5min.

I have:
First Support at 3850
Second Support at 3765

First Resistence at 3905
Second Resistence at 3960

At the moment the FTSE100 has bounced off the 3905 resistence.
There are a few annoucments at 9.30am tomorrow so maybe we can expect some activity there.

Viks
 
Like I said i am not here to boast but to help others to succeed and prosper and i will certainly help them in that journey as much as i am capable of....

very , very Important article to read guys, it will save you a hell of a lot of money

Training the eye to find key trend lines is just one expertise a pro trader much learn on their way to profitability. In fact, it may just be the most important piece to the puzzle yet the most under utilized and unknown. Trend line analysis is something that not many individuals learn because it takes time and we are a culture of instant satisfaction. As we all know, may traders, investors, funds all focus on fundamentals. In addition, most other traders, investors, funds, if they use technical analysis, focus purely on the common technicals like the moving averages, Stochastics, MACD, RSI and others. These are commonly used by every technical trader in the world. They all use past data to project future results.

The market is a funny entity in many ways. It generally finds the majority and decides to go the opposite way. This can be seen with the put/call ratio and all other sentiment indicators. To summarize, when everyone is jumping off the cliff in panic, the market is usually ready to reverse and when everyone is putting their equity from their house into the market for "easy money", the market has topped and will drop dramatically. This can be seen just by looking at the last 2 years in the stock market or in the housing market. It also can be seen last November, when the lows were hit and the DOW had 500 point intra day swings like it was a giant brushing off a fly. The panic was in the market in November, and at those lows the VIX (fear index) saw unheard of numbers over 80. The normal range for the VIX previously had been 10-40. At 40, the market had previously hit the highest fear level. So obviously, at 80, it was all out panic and thus a major buying opportunity for a month or two rally.

My point is this. Trend line analysis is a little known art. It is something that takes years to train the eye to see easily. However, once completed and trained, it opens a whole new world. As I have continued to master the markets as part of InTheMoneyStocks.com, I have continued to train my eye to spot these trend lines. By purely focusing on price, pattern and time we have eliminated all the nonsense every other trader is looking at. Just like the VIX and other psychological indicators show us the emotion in the market and the right move is almost always the opposite, the same applies to technical indicators. When a majority of the traders, investors, funds use certain technical indicators, they stop working. At first, as they begin to get more popular they still work a majority of the time, as they get more and more popular however, they work less and less. Why? Because in the market there is always a winner and loser and emotion rules. The more people that try and go short at the resistance level on a moving average, the less likely it will work due to basic laws. Remember, go the opposite of the crowd. I never trade off a Stochastic, RSI, MACD or any other technical indicator other than to look for divergences occasionally. Price, pattern and time are my Bible, Torah or Koran.

Trend line analysis is not something easy and that is why people do not learn it. Traders are just like majority this world. They are naturally lazy and want everything instantly and to profit immediately. That is why the basic technical indicators are loved. Computers can program them in, no work for the individual and they pop up on the chart. Those are the traders that will ultimately lose or never get to the elite trader status.

Work hard, educate yourself and spend time truly learning pattern, pricing and time values and the profits will come.

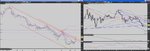
The best example I can give is the chart below of Goldman Sachs. What Goldman Sachs shows is repeated on hundreds of charts every day. It is common and it is using the "normal" technical trader to coax them in a short trade and stop them out. About 1 out of every 100 trader knows how to use trend lines properly. Have you ever been in a trade where you shorted up against a major moving average, the stock continued higher, you got stopped out and then just a little while later the stock rolled over. Then, you kick yourself for not holding longer? This chart below explains why?

Note in the chart below. There is the major 200 moving average coming into play on the upside as Goldman Sachs screams higher. As Goldman hits the 200 moving average, most traders take their short positions. This is where the mistake is made. Note the trend line drawn in just above, which is clear as day and stretches back 3 days. This is the true level Goldman Sachs will see and those few that know trend line analysis will be ready. The "normal/average" trader, after shorting at the 200 moving average, is beginning to feel the pain as Goldman pushes higher. Goldman Sachs spikes over the 200 moving average by a full dollar at which point those who shorted at the 200 moving average would cover their position. Little do these traders know, Goldman Sachs just hit a key resistance level as shown on the chart below.

Those pro and elite traders that know trend line analysis will have waited patiently as every other trader shorts the 200 moving average. As Goldman Sachs hits the trend line, the elite traders short. Goldman Sachs falls from that trend line resistance point and profits are made for the elite.

Learn your trend line analysis. The profits will finally start and grow. Enjoy free analysis on our Rant & Rave blog at InTheMoneyStocks. Also, enjoy the Research Center, our top educational and market guidance tool for elite traders.
 
I'm not sure if I'm imagining it but I seem to make most of my profit in the evening period or by taking profits in the morning from overnight positions. I then give a lot of it back during the day!

Maybe I should just work from 6am-9am and then 6pm-9pm?? :idea:
 
closed my S&P position for a 20 point profit!!

Evening guys.....what a crazy market the FTSE is up and all those shorting must have burnt there fingers today!!

market is oversold like I stated this morning, my analysis was right but my entry points were wrong!!

Like I said guys, who cares which way the market moves just trade it either way for a quick 10-20 point scalp and worst case scenario your stop loss gets hit and your ready for the next trade!!

the thread has been very active today, i am really happy to see that

after todays rally i will now be shorting again!!

I have shorted S&P again @ 769 ...stop loss 790!!

There was only a rally in the afternoon. I was at work, then .:D I shorted in the morning. No burnt fingers.

I'm pulling your leg, mate. I'm glad that you did well.

Split
 
FTSE10024022009.jpg


Here's some trendlines I've been trying out on the FTSE for the hourly.
Since Feb 13 we've been in a downtrend and it looks as if we're about to break out of the trend and then I'd be bullish. If the market stays within range I'd be bearish.

Any views?
 
There was only a rally in the afternoon. I was at work, then .:D I shorted in the morning. No burnt fingers.

I'm pulling your leg, mate. I'm glad that you did well.

Split

haha........split your a good man!

promise me you will keep posting on here and keep arguing with me and i will remain happy ..haha!!

the only way we will become better traders is when you have 2 people with opposite views at loggerheads with one another, it makes you re-evaluate your current and future positions just in case you make a mistake

so thank you my friend
 
Wallstreet,

I've signed up to that inthemoneystocks e-mail, but where on that site is that article? I'd like to see the chart it talks about...
 
I just thought I post some more pretty pictures for you all! :)

The interesting thing about channels, trend lines, etc, is the fact that it's so subjective, to the point where I imagine no 2 chartists would have the lines drawn in the same place.

I have a 3 min chart, that looks like crochet, with trendlines everywhere... I shan't post it, it's a real mess! Anyway, I managed to get 4 out of 5 trades right today, some bye finding bounces of trendlines. The only issue I have, is that I feel like I'm trading on probabaility, and I'm not sure that's sensible?

What do you think WS, and others who work in this way?

Have a fab evening all!

edit: 15min on left... daily on the right
 

Attachments

  • channels_3.jpg
    channels_3.jpg
    112.5 KB · Views: 123
I just thought I post some more pretty pictures for you all! :)

The interesting thing about channels, trend lines, etc, is the fact that it's so subjective, to the point where I imagine no 2 chartists would have the lines drawn in the same place.

I have a 3 min chart, that looks like crochet, with trendlines everywhere... I shan't post it, it's a real mess! Anyway, I managed to get 4 out of 5 trades right today, some bye finding bounces of trendlines. The only issue I have, is that I feel like I'm trading on probabaility, and I'm not sure that's sensible?

What do you think WS, and others who work in this way?

Have a fab evening all!

edit: 15min on left... daily on the right

How do you attach pics like that? Everytime i do it i have to upload it onto photobucket then stick in the link in the 'insert image' button.

Viks
 
How do you attach pics like that? Everytime i do it i have to upload it onto photobucket then stick in the link in the 'insert image' button.

Viks

Click the manage attachments button, and upload in the dialogue box, direct from your desktop.

Let me know if you get stuck, and I'll talk you through it.

Ollie
 
Here's some trendlines I've been trying out on the FTSE for the hourly.
Since Feb 13 we've been in a downtrend and it looks as if we're about to break out of the trend and then I'd be bullish. If the market stays within range I'd be bearish.

Any views?

Viks, I think you should be drawing channels as paralel lines. If you're drawing trend lines, they should be drawn across the bottom of all the lows in an uptrend, and across the tops of the highs in an downtrend.

Someone please correct me if I am wrong?

Do you have a good TA book? That would help to describe the process more clearly.

To answer your earlier question, I paper traded for 8 months, now I am in my first month of live trading, with small positions. I have a few hundred pounds in my account. I have made more money trading and owning shares, than through spread betting, or CFD! Everyday I screw up, and break a rule of my strat, but then I learn something new too, so it's ok... this is a tough business I reckon. I ran my own business for 9 years, that was easy compared to trading I think.

Anyway, hopefully you will get back on your feet with iii, etc. Good luck with it Viks.
 
hello all and Geofract..et al
im currently S/B and as somebody has already mentioned i dont even like the word..
if you guys are not s/b then how are you mnaging to trade whats brokers/sites/software are you using?
thanks in advance
 
hello all and Geofract..et al
im currently S/B and as somebody has already mentioned i dont even like the word..
if you guys are not s/b then how are you mnaging to trade whats brokers/sites/software are you using?
thanks in advance

I think we're all SB here, save for Wallstreet, who is CFD. I have traded CFD, but only with a virtual account. Lots of people using IG, CMC, iii here... and know doubts a few other brokers besides.

Anyway, welcome on board Hairyman!
 
Top