Making Money Trading

Which market do you want to learn to trade?


  • Total voters
    101
  • Poll closed .
Status
Not open for further replies.
This is the kind of candle that you are waiting for.

This was an EXCELLENT trade today in the Dax.

================================================================

psssssssssssst --- in english, its called a "long legged doji"

just being a smart **** here --- nice methodology even if you should be using the LRC and s+r

if you wish to add to its accuracy, use normal bollingers and a stochastics --- if it closes OUTSIDE of the bols, youve got a WINNER, which will be confirmed by the stochastics giving a BUY signal

the same going for the SHORT side run also --- closes ABOVE the bols !

btw, bollinger has opened a new website for ONLY forex and the bol bands !
LOL

mp
 

Attachments

Last edited:
Gbp/jpy

As mentioned in the PM I started messing around on GBP/JPY, putting in S/R lines and on the hourly chart saw what I believe to be a pin (am only on about page 27 of this thread). Thought I'd jump on for a very small amount as a test trade. I've highlighted it on the attached as requested. There are no fibs on this, just the S/R lines so not really a perfect Dante trade 😉

Also I think the body is probably too small....
 

Attachments

  • Screenshot-GBPJPY - Spot FX GBP-JPY (23-APR-08)    20,481.0 (-0.28%)    1 hour  20:40.png
    Screenshot-GBPJPY - Spot FX GBP-JPY (23-APR-08) 20,481.0 (-0.28%) 1 hour 20:40.png
    38.2 KB · Views: 378
As mentioned in the PM I started messing around on GBP/JPY, putting in S/R lines and on the hourly chart saw what I believe to be a pin (am only on about page 27 of this thread). Thought I'd jump on for a very small amount as a test trade. I've highlighted it on the attached as requested. There are no fibs on this, just the S/R lines so not really a perfect Dante trade 😉

Also I think the body is probably too small....

Knight,

there are readily available s+r overlays for the MT4 charts that do the lines for you !

mp
 

Attachments

This is the kind of candle that you are waiting for.

This was an EXCELLENT trade today in the Dax.

And the same in the EuroStoxx. Wussed out of taking them as was busy shorting Gold, but spent the rest of the day kicking myself.😡 Next time .....
 
================================================================

psssssssssssst --- in english, its called a "long legged doji"

just being a smart **** here --- nice methodology even if you should be using the LRC and s+r

if you wish to add to its accuracy, use normal bollingers and a stochastics --- if it closes OUTSIDE of the bols, youve got a WINNER, which will be confirmed by the stochastics giving a BUY signal

the same going for the SHORT side run also --- closes ABOVE the bols !

btw, bollinger has opened a new website for ONLY forex and the bol bands !
LOL

mp

Boss

You`re wrong IMHO, thats a hammer - not a longlegged doji, a doji would have almost no real body and would not look like a hammer. A grave stone doji is obvously closely related.

But you`re spot on with the Bols - wait for closes outside 20,2 bols - I think thats what you`re referring to..unless you`re using other measures for bols.
For stochastics, I take it you`re referring to slow..

Cheers
 
ANother example of confluence. Where resistance/ support lines almost line up exactly with the 38.2 Fib. There was no pin bar - But I dont think one always needs it. There was massive divergence in slow stoch and macd on the 1hrlies on that day in the morning. The rest of the day was a free fall.
 

Attachments

  • g3.jpg
    g3.jpg
    91.5 KB · Views: 338
  • g4.jpg
    g4.jpg
    87.8 KB · Views: 279
Boss

You`re wrong IMHO, thats a hammer - not a longlegged doji, a doji would have almost no real body and would not look like a hammer. A grave stone doji is obvously closely related.

But you`re spot on with the Bols - wait for closes outside 20,2 bols - I think thats what you`re referring to..unless you`re using other measures for bols.
For stochastics, I take it you`re referring to slow..

Cheers

=========================================================

OOOOOOOOOOOOOOOOOOOOPS --- there go MY candle credentials --- XTREMELY long legged hammer is what it is by golly !

correctomundo on the bols and a slow stoch on 5,2,3 (which isnt so SLOW, after all) does a fair job which can also be backed up by an RSI (4-6)

the s+r overlays i attached back there do a really swell job, methinks !

a doji has NO body, just two shadows running north-south, and east-west

DONT lecture me about gravestone doji's BUB !

LOL

"hiding head in sand"

mp
 
As mentioned in the PM I started messing around on GBP/JPY, putting in S/R lines and on the hourly chart saw what I believe to be a pin (am only on about page 27 of this thread). Thought I'd jump on for a very small amount as a test trade. I've highlighted it on the attached as requested. There are no fibs on this, just the S/R lines so not really a perfect Dante trade 😉

Also I think the body is probably too small....

Body isn't too small, but the bottom tail is a bit short, and doesn't really go low enough below the previous bar. Also, the top tail is far too long - it should be pretty much non-existant. The bar you highlighted is really more of a doji rather than a pin-bar.
 
As mentioned in the PM I started messing around on GBP/JPY, putting in S/R lines and on the hourly chart saw what I believe to be a pin (am only on about page 27 of this thread). Thought I'd jump on for a very small amount as a test trade. I've highlighted it on the attached as requested. There are no fibs on this, just the S/R lines so not really a perfect Dante trade 😉

Also I think the body is probably too small....
========================================================

while i consider TD's method to be an extremely good one for newbs and more experienced because the candle is ESSENTIALLY a CONFIRMING CANDLE which obviously identifies the trade nicely, there are other candles that tell a similar tale, as you can see yours did (i havent charted it at the moment, so cant tell where its heading)

since you said you hoped on for a short run, i imagine you profited from the trade, so apparently it works !

I dont use TD's method per se, but like the warm feeling i get when the candle "hammers out the bottom" (yeah, thats REALLY what they say in the states and how it got its name !) because i basically trade the LRC and s+r, but every newb i find walking down the corridors of this site gets grabbed and shoved over here --- at least if they read and listen, they could prob make some money !

thnx again for a nice system TD --- wonder if we can get a label for you as "the great candle spotter ?" ---- almost as good as being the "grand poobah !"

enjoy and trade well

mp
 
Seems that there is a 'pin bar' on the top of yesterdays DAX trade; rejecting the S/R level at the top of the move!
I have been trading a pin on 1hr Barclays a few days back and that has profited nicley. Thanks again TD for all the 'learnings'!
Grim
 
This is the kind of candle that you are waiting for.

This was an EXCELLENT trade today in the Dax.

Hi T_D,

As I said earlier, I wussed out of taking this trade. Part of it was not been able to spot any confluence of levels/Fibs. I had a 61.8% Fib level, but couldn't see a significant s/r. If you get a chance, could you please post up a chart showing your reasons for taking the trade. Hopefully that would help me take future trades with more confidence.

Thanks.
 
Seems that there is a 'pin bar' on the top of yesterdays DAX trade; rejecting the S/R level at the top of the move!
I have been trading a pin on 1hr Barclays a few days back and that has profited nicley. Thanks again TD for all the 'learnings'!
Grim

Yes, sometimes you get a pin bar as a signal to enter and an opposing pin bar as a signal to exit.

This little phase in the Euro was beautiful (see chart)

P.S Barclays is one of my favourites 🙂
 

Attachments

  • eur.gif
    eur.gif
    22.7 KB · Views: 693
Hi T_D,

As I said earlier, I wussed out of taking this trade. Part of it was not been able to spot any confluence of levels/Fibs. I had a 61.8% Fib level, but couldn't see a significant s/r. If you get a chance, could you please post up a chart showing your reasons for taking the trade. Hopefully that would help me take future trades with more confidence.

Thanks.

You have to analyse your charts first and then and ONLY THEN look at the price action.

I know there are still many traders looking for pin bars and then looking for reasons to take them. THIS IS THE WRONG WAY TO TRADE THEM.

OK, rant over.

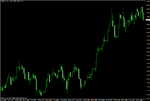
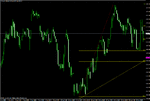
First reason I was even watching the Dax in the first place was because of this TL on the daily.
 

Attachments

  • dax1.gif
    dax1.gif
    22.9 KB · Views: 695
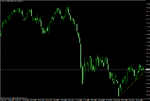
You will also see that there is a minor s/r pivot in play (marked by the red arrows).
 

Attachments

  • dax2.gif
    dax2.gif
    28.5 KB · Views: 652
This chart shows just how SIGNIFICANT that s/r pivot ZONE is when you zoom out.
 

Attachments

  • dax3.gif
    dax3.gif
    24.6 KB · Views: 708
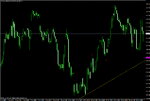
The next chart shows that the pin bar came close to the 61 fib retracement level of the swing LOW to the swing HIGH.
 

Attachments

  • dax4.gif
    dax4.gif
    29.7 KB · Views: 686
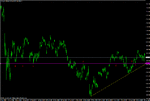
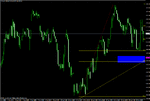
Final chart shows the blue rectangle where these THREE supporting levels come together.

Look how the nose of the pin extends into the blue area and then REJECTS IT.

To use one of Mr Gecko's phrases: "price is not comfortable at these levels".

This is why this was a good trade.
 

Attachments

  • dax5.gif
    dax5.gif
    30.1 KB · Views: 765
Last edited:
Status
Not open for further replies.
Back
Top