Making Money Trading

Which market do you want to learn to trade?


  • Total voters
    101
  • Poll closed .
Status
Not open for further replies.
Do you mind me asking do you still get time to carry out your own personal trading?(just out of interest!)

PS thanks for your replies to my previous post.cleared things up alot!

We are not allowed to trade our own accounts as it could cause a conflict of interest.

However, the prop firm backs us with money and doesn't really care HOW we trade as long as we are profitable.

So, when I trade at work, I am really trading my "own" account. It's just that I have to give them a percentage split.

That starts off as 50/50 but the more you make the more it goes up until eventually a certain amount is reached and a trader gets to keep 90% of the profit they make.

As I have said before, since your account starts at zero, it would not be a good idea to start taking trades with huge stops which is often the case with the BEST pin bars. So I look at other price action setups in addition to buying and selling off of levels.

I have explained how to IDENTIFY the key levels earlier in this thread. I use this method each and every day.

Do you have to pay desk fees + commissions out of your profits? And how much are they if you don't mind saying?
 
Hi all,

T_D i'm still alive, but lately have been looking at the fib trading thread from skunny over at FF.
Allthough it is a very good thread, i should have kept concentrating on the pinbars, for me they are more profitable :)
So back to bussines and making some money again.
grtz,
Reas
 
Dear DT and all,

Firstly, a big THANKS for all the good stuff, it's very kind of you gentleman.

1) Do you just play Pin bars ? If yes, is it just because the probablity of success is far more better than using other key reversal bars like Inside/Outside bars....etc ?

2) I apologize to be indicrete, but what is your real win/loss ratio using only Pin bars and for how many trades if you don't mind saying ?

3) Am I right when I say that a major pivot is a Support which becames a resistance and vice versa ? I tell you that because many times we could find minor pivots BETWEEN major pivots.

4) Following the question 3, do you spot only major pivots or major S/R on your chart ? I tell you that because plotting minor pivots too make the charts very overcrowded.

Thanks for your careful attention,

Happy trading all

Cheers

Angel65
 
Hi T_D (and all of T2W),

Long time lurker first time poster so go easy! First I want to echo the sentiment and say a massive thank you, the knowledge your have passed on is superb. I have been soaking in all your advice and want you to take a quick look at one of my EUR/CHF analysis. Using your methodology and based on my TA on this chart, I would have traded (I think!!), what are your thoughts on the circled pin?

Once again many thanks

SB20
 

Attachments

  • eur_chf test.jpg
    eur_chf test.jpg
    160.2 KB · Views: 629
Good evening,

1) Do you just play Pin bars ? If yes, is it just because the probablity of success is far more better than using other key reversal bars like Inside/Outside bars....etc ?

No, I play other types of price action bars. This is something I have said throughout this thread. I want people reading this to start realising that it is NOT the pin bar that makes the money it is the area it occurs at.

This means that identifying the price pivots becomes my MOST IMPORTANT TASK.

2) I apologize to be indicrete, but what is your real win/loss ratio using only Pin bars and for how many trades if you don't mind saying ?

I can't answer this with any degree of accuracy because I trade many price action setups and it would be impossible for me to go back through all of my trading history and work out which trades were the result of pin bars. However, I think it is fair to say that many of my trades are off pin bars - perhaps even the majority are - and my win/loss ratio is approximately 90%.

3) Am I right when I say that a major pivot is a Support which becames a resistance and vice versa ? I tell you that because many times we could find minor pivots BETWEEN major pivots.

A MAJOR pivot is an area where price has flipped betwen support and resistance (and vice versa) MANY TIMES. I place an emphasis on pivots that have been in play in RECENT HISTORY.

4) Following the question 3, do you spot only major pivots or major S/R on your chart ? I tell you that because plotting minor pivots too make the charts very overcrowded.

I plot my S/R pivots on the daiy and hourly TFs. I use only the immediately obvious pivots. Sometimes you do get many levels - that is just the way it goes. Other times my charts are relatively clean.
 
Hi T_D (and all of T2W),

Long time lurker first time poster so go easy! First I want to echo the sentiment and say a massive thank you, the knowledge your have passed on is superb. I have been soaking in all your advice and want you to take a quick look at one of my EUR/CHF analysis. Using your methodology and based on my TA on this chart, I would have traded (I think!!), what are your thoughts on the circled pin?

Once again many thanks

SB20

Hello,

Just a quick one for me - I'm getting less time these days what with the day job and the mentoring.

Firstly, your fibs are drawn wrong. If you are measuring the retracement in an uptrend (i.e. looking for longs) then you need to draw from the SWING LOW up to the SWING HIGH. This means that the pin comes to the 38 and not the 61. This does not make much difference here but it is still worth noting.

Secondly, although it has a fib level it has no immediately obvious S/R pivot which is the first and most important thing that I look for.

Nine times out of ten when there is no pivot, I pass on the trade.

That is certainly what I would do here.

I would also say that the body of the pin bar is a little too far up the range of the preceeding bar for my liking.

As you can see, despite the fact I wouldn't have taken it, it is still up 128 pips from entry. You will find pin bars often work when they have NOTHING WHATSOEVER going for them but for me personally I like to get all the odds in my favour before I trade. That is how I achieve a win/loss ratio of around 90%.

Tom
 
Doh! Thanks for pointing that out. Good advice, I'll be focusing on trades where I see confluence based an S/R pivot. Also just a general question I know you mentioned you scan the markets in the evening (which is what I do), but at what point do you actually open your position?

Cheers

SB20
 
Analysing a chart *Part 1*

The most important part of this strategy is identifying the points at which price has a high probability of reacting.

Once you have drawn your levels all you need to do is WAIT for the market to come to you. This is what the professionals do and it is what YOU should do if you want to be successful.

As I have said numerous times, the four steps are:

1. PREPARE YOUR CHARTS

2. WAIT FOR THE MARKET TO COME TO YOU

3. STUDY THE PRICE ACTION, CONSIDER THE SCENARIOS AND PLAN THE TRADE

4. PULL THE TRIGGER

Identifying the levels is NOT hard but it takes practice to look at a chart and INSTANTLY see them.

When you do you will be amazed. I am not exaggerating when I say that the majority of the time price will react significantly to a level that I have had on my chart for days if not weeks. Many times it hits it to the EXACT TICK before reversing.

So, I am going to walk through how I analyse a chart. I have picked a market at random to analyse and that market is GBP/JPY.

First and foremost, I like to keep things simple. If you have to squint to see a level, then forget it. I like only the most obvious.

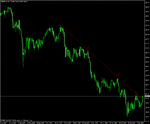
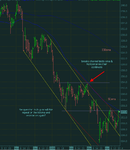
Now, the first thing I do is look for the trend and I do this by putting in trend lines. The majority of market participants use trend lines so they are essential. There are many methods of drawing trend lines but I simply connect the highs. This is what works for me. See chart
 

Attachments

  • gbp-jpy.gif
    gbp-jpy.gif
    18.4 KB · Views: 956
Last edited:
Analysing a chart *Part 2*

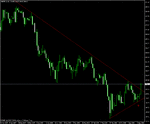
Most of the time there are trend lines that identify not only a series of lower HIGHS but also a series of higher LOWS. e.g. both ascending and descending TLs

On this chart we can see that the LONG TERM trend is DOWN and price has just broken out of that descending TL.

Now that price is creating a bullish scenario, I immediately want to see where potential SUPPORT could come in which is why I connect the lows to get an ASCENDING TL. (see chart)
 

Attachments

  • gbp-jpy_2.gif
    gbp-jpy_2.gif
    17.8 KB · Views: 967
Analysing a chart *Part 3*

Once I have the obvious trend lines in place, I then look for the S/R PIVOTS.

These are areas where previous support has become resistance and vice versa.

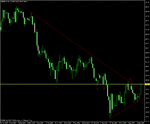
The yellow line in the chart below show a clear pivot which price is currently trading at.

It is important to remember that sometimes these pivots will be PRECISE LEVELS and sometimes they will be ZONES.

What I mean by that is that sometimes the lows (support) will match up more or less to the tick with the highs (resistance) and when you see this, you have a very definite level to take action at.

In the chart below we have more of a zone. Price has traded through our S/R level before as you can see from the wicks on the candles but it is an APPROXIMATE AREA that has served as both support and resistance in recent history.
 

Attachments

  • gbp-jpy_3.gif
    gbp-jpy_3.gif
    18 KB · Views: 925
Last edited:
Analysing a chart *Part 4*

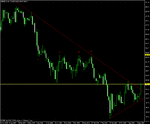
I have included the other prominent level (see chart) which shows where an area of MINOR SUPPORT became SIGNIFICANT RESISTANCE.

Since price has broken through the descending TL and is now breaking through the first pivot, if I am considering going long based on the daily TF, then this second level is my FIRST POTENTIAL PROBLEM AREA.

And that is it.

That is how simple my charts look.

I do use fibs from time to time but I tend to draw them on to see where the key levels are, see if they line up with any of my s/r pivots (making sure I make a note of them if they do) and then remove them again.

I like my charts to look clean. This keeps me very focused on the price action.
 

Attachments

  • gbp-jpy_4.gif
    gbp-jpy_4.gif
    18.1 KB · Views: 955
Doh! Thanks for pointing that out. Good advice, I'll be focusing on trades where I see confluence based an S/R pivot. Also just a general question I know you mentioned you scan the markets in the evening (which is what I do), but at what point do you actually open your position?

Cheers

SB20

I place an order as soon as the next bar opens. This, for me, is after midnight GMT.
 
Thanks, that four part example was really useful. It's amazing how S/R levels do start to jump out once you train your eye, I guess it's time to start applying this knowledge now!

Cheers
 
Mp --- Pay Attention To This Guy !

I place an order as soon as the next bar opens. This, for me, is after midnight GMT.

===============================================================

like the way you trade as its rather similar to how i do it with some differences, naturally !

where you use trend lines, i use the DeMark and LRC channels, which is essentially a top and bottom TREND LINE --- my reasons are to see the available range between support and resistance, and the DeMark trend lines are something i got from a British trader --- they apparently are becoming popular, and one only has to see where the price hesitates exactly at the line to understand they work. They are also a readily available overlay for the MT4 charting package.

our entries differ in that i will enter the trade ANYWHERE i feel, as long as my support or resistance point has been hit and the currency is moving away from it, especially if the zig zags (which make using fibs WAY WAY EASIER) agree and i feel, not waiting for the conclusion of a one hour candle but relying on resistance, gets me into a trade faster than your method, although your method is probably much "safer" than mine for newer traders.

i also use "dynamic support and resistance overlays" which will immediately clue me into any continued up or downside movement PAST the normal support and resistance overlays.

you might want to compare the readily available overlays to your own hand work in finding s+r, as its a WHOLE lot easier and faster to just have them on the screen already, and for any timeframe !

our percentage returns are pretty similar, with my having (over the past month and a half) done 98.8 % GOOD trades --- unfortunately during the month, i accidently closed two trades for a negative $4 thou (usd) and while ive never done it again, it was kinda a bad day in black rock !

but what i was saying holds --- your concept of trading is VERY good indeed and the newbs should pay UTMOST attention to what you teach --- its danged good !

good to meet a good trader again

mp
 
Interesting Trader_Dante, I saw your first post and thought "I'll follow you through."

I use channels rather than lines (although I like the 3/4 break fan). I also always have a couple of mas chosen because price suggests that the market participants seem to respect them. And I have a potential short interpretation - but having broken the first set of channels the down side seems to be weakening. Obviously time and price action will tell. Just a thought.

Note for MP this is gby/jpy, same as TD's
.
 

Attachments

  • sr.png
    sr.png
    42.3 KB · Views: 486
Last edited:
Hi DT,

Thanks for all, it's CLEAR !!

Before anything else, my principal task now will be to train my eyes in identifying the most obvious PIVOTS where Supports became Resistances and vice versa and JUST watching prices reaction AT these levels/zones.

Happy trading and have a nice week end

Take care

Angel65
 
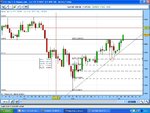
heres my 2ps worth on the same chart.
my preffered trade would have been the triangle break on the hourly.
any thoughts ??
 

Attachments

  • gb-yen-h.gif
    gb-yen-h.gif
    42.8 KB · Views: 365
Status
Not open for further replies.
Top