Hi,
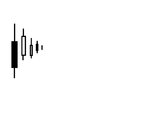
I have searched for answers on net before I have asked this question here but no luck. Can someone explain to me in plain english how Lower highs and Higher lows look like on chart please?
As far as my understanding goes Higher high happens when uptrend candlestick closing higher than previous candle (no matter how long shadows are or am I wrong?). With lower lows the same story only when downtrend occurs. But for some reason I cant imagine Lower highs and Higher lows. Is there any good website with chart examples for this set ups?
Thanks in advance.


