You are using an out of date browser. It may not display this or other websites correctly.
You should upgrade or use an alternative browser.
You should upgrade or use an alternative browser.
Ok I take you word for it 😉JonnyT said:No, it most certainly wasn't, though its looking pretty good.
JonnyT
Jonny I know you trade EUR.USD on futures. But who do you trade GBP.USD with.
I'm using the TWS chart realtime.
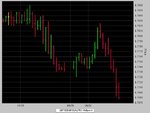
Just right click on the GBP IdealPro in TWS, choose analysis, choose realtime charts. See attached file
Works a treat though it is intensive on the CPU so be warned.
Failing that the www.dailyfx.com charts are fine as the differences between the data feeds are negliable on the 1 hour timescale I'm using.
JonnyT
Attachments
badtrader said:[I used to manage and trade Forex hedge fund accounts for high net worth individuals, funds and banks. 😉
Hmmm - sounds as if your methodology might be a bit more sophisticated than my lucky coin.......
The 17650 level is the 50 % retracement for the low on Oct 12 to the high 27 of Oct.Their is also a head and shoulders from the 25 Oct to 31 Oct, neck line broke 17730 the high was 17900 so the target is 17630. Just a couple of reason for the 17630 17650 target .
Breadman
Breadman
I can give you any number on a chart and you will find a reason, why it should be this or that. Tell me what you think of the 1,7560 levelbreadman said:The 17650 level is the 50 % retracement for the low on Oct 12 to the high 27 of Oct.Their is also a head and shoulders from the 25 Oct to 31 Oct, neck line broke 17730 the high was 17900 so the target is 17630. Just a couple of reason for the 17630 17650 target .
Breadman
badtrader said:I can give you any number on a chart and you will find a reason, why it should be this or that. Tell me what you think of the 1,7560 level
could someone put a chart up because IMHO it all depends on the time-frame?
badtrader said:I can give you any number on a chart and you will find a reason, why it should be this or that. Tell me what you think of the 1,7560 level
The 17580 17590 level would be the next one to watch. If you are greedy you might hold out for 17560.
Breadman
samtron said:could someone put a chart up because IMHO it all depends on the time-frame?
Samtron,
I look at 60min charts.
Breadman
breadman said:Samtron,
I look at 60min charts.
Breadman
thanks breadman