Best Thread learning to read price action with p/f charts

Thanks to ISATrader, am going through the lessons on the website pointed by him. As I am learning thru the PF analysis, I have the following questions aimed ONLY to assess the credibility of the double top buy signal.

In the chart for 8280-SAU, I have plotted the 5EMA and 21MA
So I will refer them as Red and Green line.

Every double top is NOT to be taken as a buy signal.
I am talking for long positions below.
-----------------------
Consider Chart 1%X2
--------------------------
Rule 1:
Red line acts as Resistance and Green As support.
If the Red crosses the Green , and a double top is created afterwards, then that double stop is more tradable.

Rule 2:
45 Angle Support and Resistance is valid for 3 box reversals and if using 2 bix reversal, then we should also draw an angled trend manually.
The Double top should created under such manual resistance or close to it should be treated in the same precaution as if that res was a 45 line resistance and we wait to enter when the X column past that Resistance.

Rule 3:
The two tops of the Double top and the double top itself if created just on the resistance should be avoided.

8280_1%x2.png
In the chart above:
Double top created at Point A IS NOT TO BE taken although it fulfills Red crossing over Green but it is taken ONLY when it crosses the manual resistance drawn -orange color. Now this orange color resistance can not be drawn with updata as it
is not a 45 line (the chart is 2 rev boxes). Violate Rule 2

Double top at B IS TO BE taken because it is created long after the ma cross over and also the orange res line is broken.

Double top at C is NOT to be taken because it violates Rule 3.

Double top at D IS TO BE TAKEN obviously.

Now interestingly I changed the chart to 3 box reversal.
Noticed the following.
At point B there is an automated 45 resistance and even manual 45 angle res can be easily created. So the rule that 45 trend is valid for 3 box reversal is more true.
And we would have avoided that double unless it crosses the resistance.

8280_1%x3.png

What do you think about these rules.
 
I would like to know how you guys would trade this symbol in future, what would you expect the columns to make from this point onwards and when do you enter and why?

Of course I HAVE given my point of view but if you take the simplePF chart attached, how would you go about it in future?


8300-pf.png

8300_line.png

8300_1.5%X3.png

8300_haikanshi_Future.png

8300_haikanshi.png

Lets suppose the most active stocks and volume ones are trending side ways, how will you react to such stocks as a PF strategist.
You can always stay on the side and be safe but is there a way PF charting can find buy and sell signals in such a scenario.

Please see 8300 symbol attached and as you can see strong Uptrend from 16 oct to 11 Nov, And since then it is choppy and lately
in a downtrend. This is the positin as of Today and you have put this chart under your watch list.
I am not talking about back testing but tryng to understand what would happen in future that I would trade this one?

Questions:

1. What will you need to see happening in PF to go long on this one in the coming days. I mean a double top or triple top will be enough?
I guess no, you need to combine a buy signal that will happen next with a strong signal that a trend is reversing.
In a PF how is the trend reversal is identified. A double bottom created at the bottom (close to the support) is enough?
You would need to see the Candle stick charts making a pattern like head shoulder or double bottom W (not the pf double bottom).

2. I have drawn the probable areas in future. As per candles, the reversal can happen if we see a W pattern and break of the HH
which is at price 111.5 While in PF chart the double top will happen at 106. Can this 106 double top be taken as the reversal change?
of courese am assuming that the current X column will move in the same upward direction. Otherwise anything can happen, price can
moe down tomorrow making Os. However I need to know what would make this symbol tradable so I wil wait for that to happen?

3. The volume is high on average 50 Millions SAR traded daily. I could day trade it to make money etc bt am not into day trading.

4. As per the traditional line chart , the price has bounced off from a recence support and if it continue up breaking that resistance shown
as red angled line, we could enter long. By the way, the brak point would be ~ 107-108.

i will appreciate to know how woukld you trade this in future?

Cheers
 
hi oracle
looks like you have a major support zone at 95-98
1.5% by 3 looks to be too low/columns are too long
need to see 2.0%,2.5% and 3.0%
there should be a well defined supp zone in there somewhere
at this point we dont really know if the minor downtrend will continue or it will reverse and carry on upwards
imho
the higher box sizes will bring the columns closer together
but....then look at horizontal s/r
then a couple of 45 deg lines at column tops and bases
 
Please find attached several higher boxes chart.
There is a 2 reversal box attached too which looks having a single external good support, but i wa kind a shifted towards 3 box reversals only. So do tell me your opinion about 2 box reversal, can i trade using 1.3%X2?
8300_3%X3.png

8300_2.5%X3.png

8300_2%X3.png

8300_1.3%X2.png

hi oracle
looks like you have a major support zone at 95-98
1.5% by 3 looks to be too low/columns are too long
need to see 2.0%,2.5% and 3.0%
there should be a well defined supp zone in there somewhere
at this point we dont really know if the minor downtrend will continue or it will reverse and carry on upwards
imho
the higher box sizes will bring the columns closer together
but....then look at horizontal s/r
then a couple of 45 deg lines at column tops and bases
 
ok
you got the message now
so..we have seen that major supp area and the bounce from it
now...we need to track the bounce
a bad bounce and the shorts move in for the kill
but then re watch that main supp area..it is more defined on the 3 box
this advise is gonna cost you 2 camels ....lol
 
on the 2.5% by 3 there is a supp before it broke downwards
prev b/o...supp.could be res
 
ok
you got the message now
so..we have seen that major supp area and the bounce from it
now...we need to track the bounce
a bad bounce and the shorts move in for the kill
but then re watch that main supp area..it is more defined on the 3 box
this advise is gonna cost you 2 camels ....lol

In other words the main support that is visible on 1.3%X2 showing bounces at the early time period and then only at the current time period for few bounces is mapped better on the 2%X3 chart. In the 2%X3 chart, the second last support is the one which appears as the main support in 2 box reversal, but in the 3 box, this support is drawn better.

A camel here is considered a very expensive animal given on occasions like marriages so I would send you one for now i wish i can attach him with this message ;-)
 
on the 2.5% by 3 there is a supp before it broke downwards
prev b/o...supp.could be res
Yes the support looks great as it touched at start, middle and towards the end before braking and price crosses it
In this case , what we do ? we could wait and see how price develps, like further dips down, then as you said this supp can become a resistance, OR price can move back on the main trend.
So basically the idea of going long at the touch of main support will not always work as in this chart, it breaks the support.

Unfortunately I can not go short in this market, only long.
 
never make predictions
we are seeing the reaction of buyers and sellers in our s/r areas and then looking at signals generated
 
malaguti..good stuff
there were some good trades taken on that trend
keep em comin
 
oracle
forgot to add
once you have identified the possible breakout
part of the analysis is to look for traps...
these happen usually at major supp/res etc etc
failed break=a trap=a fake and in an early trend=a shakeout
 
oracle
also..the post breakout area is just as important
make sure there are no traps looming
 
the 10 and 30 year bills are looking for a rise in interest rates
not good for stocks
keep an eye on this trend
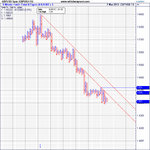
dow index 15 min
shows the trend from 25 feb
a very intense trend .support for this should start in 13,350 region
then the next support is marked by widening the chart area/drop down a box size
16 points by 1 reversal
15 min close plot
14bj75v.gif
 
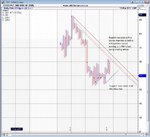
Evraz double bottom about to take place High low shows new potential downtrend, whereas the close chart believes its been brearish for quite some time. Possible support with the internal
 

Attachments

  • Evraz.JPG
    Evraz.JPG
    346.6 KB · Views: 203
  • EVRAZ PLC ORD USD1.00.jpg
    EVRAZ PLC ORD USD1.00.jpg
    817.1 KB · Views: 184
hi malaguti
it looks like evraz broke res on the close chart..300p
trackthe latest uptrend on say 2hour 2 by 2 /close
and possibly some others
you should then get an idea of where the support areas are
market makers will want to test the bulls,especially if it broke a key level 300p
 
hi malaguti
it looks like evraz broke res on the close chart..300p
trackthe latest uptrend on say 2hour 2 by 2 /close
and possibly some others
you should then get an idea of where the support areas are
market makers will want to test the bulls,especially if it broke a key level 300p

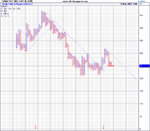
Only thing I can see is support coming from the daily chart, anything intraday, is down, tracking the down trend from 315. 2 hrly, 2x2 attached, but they are all the same..no support except from 5x3 close.
 

Attachments

  • EVRAZ PLC ORD USD1.00.jpg
    EVRAZ PLC ORD USD1.00.jpg
    1.4 MB · Views: 172
ok
yes i saw the supp showing up on the daily
probably the best idea could be is to track that downtrend on the 2 hour.there will be a trendline cluster somewhere.take that as being the res for that trend.there will be others
you need to see reactions at these levels,or take profits on any longs
if supp comes in ..look for a fib/50% of that move down
just an opinion
it is a messy chart
price moving around...but no decent break
 
Sorry to enter into conversation except am learning from you two.
The chart shows price has to go up all the way passin 38.2 fib to make start of evr.pngthe reversal?
 
Top