Key To Markets - Discussions

AUDUSD: Friday’s pivotal 0.7870-0.7840

In response to Lowe comments, investors sold off the AUD in the Asia afternoon in the FX markets.

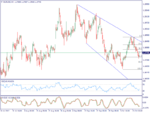
AUDUSD trading below 20 and 50MA and settles below 0.80 mark. After the RBA Governor Philip Lowe speech Aussie diving to 0.7916 lowest point of the day. Psychological support finds at 0.7900 below this 0.7870 earlier swing lows as shown in the below chart and coincides with 100.0fe.

Intraday pivotal finds at 0.7860-0.7840 below this 0.7800-0.7790 expected. A deep cut expected if 0.7800 taken out to re-test 0.7750 it’s 20ma weekly.

Intraday momentum remains down, we are watching 0.7870-0.7840.

Alternatively, intraday resistance seems at 0.7960, 0.8000 and 0.8040.

Monthly range: 0.8000-0.7750.

Lack of upcoming (next week) local economic events AUDUSD cast on US GDP data outcome.

AUDUSDH4-2.png

It is important to always keep in mind the risks involved in trading with leveraged instruments.

What is your Technical View?

Do you have a different idea? Please leave us a comment and get an answer from our professional analysts.​
 
GBPUSD: Near-term downside risk available

  • Pound plunges on Theresa Brexit speech, closed at 1.3494 on Friday.
  • Last week’s GBPUSD price action paused the four-week rally.
  • Near term trading range remains between 1.3450-1.3600

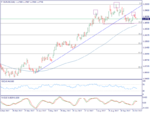
The five-day consolidation likely to excel the bearish theme after a spectacular rally from 1.2780-1.3650 nearly 8% appreciation.

GBPUSDH1.png


The lower end of the current trading range 1.3450 coincides with 23.6% fib (Aug-Sep rally) below this 1.3415 and 1.3380 its 100MAs (weekly) exists.
Resistance seems at 1.3550, 1.3600 and 1.3650.
A move below 1.3380 needed to -retest the 38.2% (Aug-Sep rally) 1.3320 and 1.3270 early August high.

GBPUSDDaily-2.png


The daily RSI and oscillator remain bearish.
View: We believe the price likely to re-test the higher end of the symmetrical triangle (blue line)

It is important to always keep in mind the risks involved in trading with leveraged instruments.

What is your Technical View?

Do you have a different idea? Please leave us a comment and get an answer from our professional analysts.​
 
  • Germany political uncertainty weighs EUR on Monday session
  • Retrace to the lower end of the consolidation range
  • Bullish views remain on EUR against JPY, CHF, USD and NZD
US dollar retraced this past week after the Federal Reserve announced Balance sheet normalisation will start in October. We believe tactical USD retracement in the near term.

Besides Flash PMI data from EZ, France and Germany beat expectations.

According to Chris Williamson, Chief Business Economist, IHS Markit “The eurozone economy ended the third quarter on a strong note, with growth of business activity picking up to its highest since May to register one of the strongest monthly improvements seen over the past six years. The data also point to rising price pressures, opening the door wider for a tapering of stimulus by the ECB”.

Politics back to the limelight. After German election FX markets are watching Spain referendum on 1st October.

Data review:

  • August 2017 EA annual inflation up to 1.5% and up to 1.7% in the EU.
  • In July 2017 the current account of the euro area recorded a surplus of €25.1 billion.
  • Economic Sentiment for Germany improved 7.0points in September 2017, now stands at 17.0 points.
  • ZEW Economic sentiment improved by 2.4 points to a reading of 31.7 points
  • Germany Flash Manufacturing PMI 60.6 vs. 59.3 August
  • Germany Flash Services PMI 55.6 vs. 53.5 August
  • EZ Flash Manufacturing PMI 58.2 vs. 57.4 August
  • EZ Services PMI 55.6 vs. 54.7 August
  • The ifo Business Climate Index fell in September from 115.9 points to 115.2 points
Upcoming data:

Wed, Sep 27
M3

Barclays: We expect euro area M3 annual grow rate to edge up to 4.7% in August, supported by loans to the private sector rising 2.7% y/y, up 0.1pp from July.

Thu, Sep 28
Germany Gfk Consumer Climate

Fri, Sep 29
Flash CPI

Barclays: We expect headline inflation to edge up 0.1pp to 1.6%, supported by energy and food prices, while we forecast core inflation to ease to 1.1% from 1.2% previously, as we expect airfares to pay back at the end of the summer season.

TECHNICAL VIEW​

Following Germany election, EURUSD retraced back to the support base and re-tested the 50MA. Past one-month price pattern confirms the bearish H&S pattern formation (below chart). Neckline finds between 1.1820-1.1840. A move below this needed to retrace further South to 1.1800, 1.1770/1.1750 and 1.1700. The recent pullbacks are shallows.

EURUSDH4-4.png

Medium-term potential support finds between 1.1630 and 1.1590.

The overall trend remains bullish and the EUR strength likely to continue to the October meeting.

Bearish scenario: A daily close below 1.1660 near-term could shift the trend to mild-bearish, 1.1620/1.1600 and 1.1550 expected.

EURUSDWeekly.png

The daily RSI and Oscillator are sloping down.

A retracement in EUR crosses (EURJPY ,EURCHF and EURNZD) are offering better risk-reward ratio.

View: EURUSD offers further legroom available in the near term.

It is important to always keep in mind the risks involved in trading with leveraged instruments.

What is your Technical View?

Do you have a different idea? Please leave us a comment and get an answer from our professional analysts.
 
BRENT: The next level in focus is 59.70/60-61.0$

Brent oil gave another breakout on Monday session, re-fresh 2017 high. It surges 4% to settle at 59.20$ highest closing price since mid-July 2015 on Monday session.

The combination of following bullish factors well supported the recent price action:

  • Kurdish referendum intensifies Iraq’s fuel supply risk, lift the price to two- year high.
  • Deal extension expected beyond 2018 1Q.
  • US oil drillers cut the number of oil rigs.
  • Hedge funds raised their bullish bets
According to Reuters, “OPEC and other oil producers are clearing a glut that has weighed on crude prices for three years and may wait until January before deciding whether to extend their output curbs beyond the first quarter of 2018, ministers said on Friday”.

Drillers cut five oil rigs in the week to Sept. 22, bringing the total count down to 744, the least since June, Baker Hughes said in its closely followed report on Friday.

The higher low pattern 100.0fe seems at 59.70 rounded to 60.00$, yesterday’s high 59.20$. The daily RSI at overbought but the oscillator remains bullish. If propel above 60.0$ could lift price further to 80.0% fib reaction to 61$ (69.60-27.00$ fall). Getting above 61$ could open further to 67+$.

Support finds at 58.30 and 57.20.

View: The daily RSI breakout needed to forecast further bullish reaction. Feb 2012 RSI high was 81.60, currently, stands at 78.60.

BRENTDaily-3.png

It is important to always keep in mind the risks involved in trading with leveraged instruments.

What is your Technical View?

Do you have a different idea? Please leave us a comment and get an answer from our professional analysts.​
 
Gold: Sitting at 50.% fib reaction.

Gold price extends the weakness on the third straight week and retraced 50.0% (1204.80-1357.50 rally).

The world’s largest gold ETF-SPDR gold trust positions increased by 0.24% compared with Tuesday, the current positions of 864.65 tons.

Intraday supports finds at 1281 and 1279 its 100DEMA below this 20WMA exists 1274 and 100DMA at 1272. In Asia session, we believe the price likely to hold the 1281-1279 zone.
Resistance seems at 1289, 1297/1299 and 1304.00

Medium term: Fib reactions find at 1263 the 61.8%, coincides with 200DEMA and earlier swing high (below chart). The 200MA finds at 1249.

XAUUSDDaily.png

The daily RSI sloping down and the oscillator remain bearish. Recent dollar strength pressures the precious metal.

View: We are waiting for 61.8% fib-1261 (20MA monthly)

It is important to always keep in mind the risks involved in trading with leveraged instruments.

What is your Technical View?

Do you have a different idea? Please leave us a comment and get an answer from our professional analysts.​
 
EURUSD: Respect the 2015 August low.

Overview: Friday’s closing price is the last trading day for a month and quarter as well. Monthly price action down 1.5% erased last month gains. On a quarterly basis rose 5.5% compared to 7.0% Q2.

Forecast review: The price has been moving higher for six consecutive months. Since July we repeatedly advised “either fifth or sixth month the rally likely to end”(below chart)

Earlier forecast : Chart

EURUSDMonthly-2.png

Near-term: EURUSD made a low at 1.1716, respect the 2015 August low 1.1710 and change the direction. Near-term oversold condition pushes the price higher 1.1800. On the H4 chart, RSI and Oscillator are bullish.

Resistance seems at 1.1800, 1.1850 and 1.1910

Supports moved to 1.1710/1.1700, 1.1660 and 1.1600 it’s 50.0% fib (1.1100-1.2090 rally)

Last week’s corrective pullback printed a bearish pattern and completed the ABC target. Potential resistance seems at 1.1830/1.1850 levels. Our bearish reaction forecast in our Tuesday’s article completed the downside target.

We shifted our near-term bearish take to neutral. We believe near-term price action remains in a tight range 1.1660-1.1910.

EURUSDH4-5.png

It is important to always keep in mind the risks involved in trading with leveraged instruments.

What is your Technical View?

Do you have a different idea? Please leave us a comment and get an answer from our professional analysts.
 
AUDUSD: Weekly pivotal seems at 0.7960

  • The Aussie dollar closed at the lowest point in the Q3
  • RBA meeting in focus, 3 October 2017, 2.30 pm AEDT

    This week RBA is the main driver to AUD. We believe the RBA likely to keep policy unchanged.

    Monthly price action down 1.8%, and on a quarterly basis rose 2.0% compared to +0.6% Q2.

    Last week’s price action re-tested the earlier swing low at 0.7800. Immediate support finds at 0.7790 below this 0.7740 exists.

    A move below 0.7740 needed to extend the retracement to 0.7700, 0.7620/0.7600. Resistance seems at 0.7870, 0.7960 and 0.8000.Weekly pivotal seems at 0.7960 until remains below the price likely to re-test the earlier breakout zone.
    Medium-term additional support finds between 0.7515-0.7500.

    Fib reactions (May -Sep rally):
    50.0%@ 0.7725 and 61.8% @0.7630.

    The daily RSI sloping down but near to oversold level. We believe RBA event unlike to raise the volatility but the movement in USD and commodities cast the trend.

    Weekly support zone: 0.7790-0.7740

    Monthly range: 0.8000-0.7500.

    AUDUSDDaily.png

    It is important to always keep in mind the risks involved in trading with leveraged instruments.

    What is your Technical View?

    Do you have a different idea? Please leave us a comment and get an answer from our professional analysts.

 
Brent weekly preview: Limited upside risk available

Brent oil fell 2% on Monday as signs of higher output from OPEC countries and rise of U.S drilling activity.

Before retrace, to 40.0% fib (mid-August-Sep rally) the price completed the 100.0fe daily target. It has been traveling south for five straight sessions and re-tested 20MA.

Recent price action capped between56.50 and 57.30 and erased the four-week ascending channel. Potential support zone remains between 54.80-54.50 (below chart). Additional support finds at 53.50 its 50DMA.

The daily RSI sloping and oscillator turn bearish.

Resistance seems at 56.80, 57.10 and 57.80. Weekly potential supply zone remains between 57-57.75.

In our last week’s article (26 Sep) we forecast “The next level in focus is 59.70/60-61.0$”. It has made a high at 59.50 and changes the direction.

BRENTDaily.png

We are not discounting the fact that, earlier price action gave an upside break through 29month and eight-month descending trendline.

In an extreme bullish case: Propel above 60.0$ could lift price further to 80.0% fib reaction to 61$ (69.60-27.00$ fall). Getting above 61$ could open further to 67+$.

BRENTDaily2.png

View: Limited upside risk available

It is important to always keep in mind the risks involved in trading with leveraged instruments.

What is your Technical View?

Do you have a different idea? Please leave us a comment and get an answer from our professional analysts.
 
AUDUSD: Bullish reaction expected.

The Aussie dollar manages to hold the support after the RBA kept the cash rate on hold at 1.50% on Tuesday. The RBA decision was widely expected and our reaction to the RBA outcome is bullish. The bank’s outlook for the domestic economy is bullish, there were no major changes in the statement.

Statement summary on the domestic economy:

The RBA noted, “Over recent months there have been more consistent signs that non-mining business investment is picking up”.
Business conditions are at a high level and capacity utilization has risen. Infrastructure investment is also supporting the outlook.
Comments on the labor market: Recent months, employment has continued to grow strongly accompanied by a rise in labor force participation. In contrast, Wage growth remains low, but the stronger conditions in the labor market should see some lift in wage growth over time.
The unemployment rate is expected to decline only gradually over the next couple of years.
Regarding the currency, “The higher exchange rate is expected to contribute to continued subdued price pressures in the economy”.

FX technical overview:

Following the RBA decision widely expected, AUD well supported against USD. Last four trading sessions price action appears higher risk.

It has a potential support zone remains between 0.7775 and 0.7750. Earlier resistance level acting as a potential support. 0.7750 was a key resistance level between Nov 2016-Mar 2017 (below chart).

AUDUSDDaily-1.png

The daily RSI appears changing direction but the oscillator remains bearish. We believe a bullish reaction until 0.7750 holds on a daily closing basis. In this case, 0.7870 and 0.7900 is an initial target, later 0.7930 expected. Buying between 0.7820-0.7800 favors the trend.

Bearish case scenario, 0.7710/0.7700,0.7660 and 0.7620 expected.

Resistances seem at 0.7840, 0.7870 and 0.7930. The further bullish reaction could be expected above 0.7940.

AUDUSDDaily2.png

It is important to always keep in mind the risks involved in trading with leveraged instruments.

What is your Technical View?

Do you have a different idea? Please leave us a comment and get an answer from our professional analysts.​
 
GBPUSD: Retraced 50.0%

UK September Manufacturing and Construction PMI were disappointed the FX markets. But yesterday’s Service sector was registered better than expected.


  • UK Manufacturing PMI registered at 55.9 in September, down from August’s four-month high of 56.7.
  • UK Construction PMI registered 48.1 in September, down from 51.1 in August. Business activity falls for first time in 13 months and it was a sharpest drop in civil engineering work since April 2013.
  • UK Services PMI Business Activity Index posted 53.6 in September, up from an 11-month low of 53.2 in August. On a Q/Q basis, growth has eased slightly since the previous quarter (the index averaged 54.3 in Q2, compared to 53.5 in Q3).
Upcoming event:

Fri, Oct 05

Speeches:

  • MPC Member McCafferty Speaks at The Founders’ Company Annual Lecture, in London
  • MPC Member Haldane Speaks at the Economic Research Council, in London
  • FX overview

GBPUSD: Retraced 50.0% (Aug-Sep rally)​

The cable has a near-term supports finds at 1.3230 below this 1.3180 and 1.3150 exists. Resistance seems at 1.3290 and 1.3330. Ahead of NFP (Friday) the trend remains between 1.3130 and 1.3330. If propel above 1.3330 the cable could extend to 1.3370/1.3400. Alternatively, 1.3150/1.3130 expected.

GBPUSDH4.png

It is important to always keep in mind the risks involved in trading with leveraged instruments.

What is your Technical View?

Do you have a different idea? Please leave us a comment and get an answer from our professional analysts.​
 
FX overview ahead of NFP.

Renew optimism over the US tax reform pushing the dollar index higher against its major peers. Ahead of today’s September NFP the DXY trading on a verge of a break. Parallel resistance seems at 94.15 above this 94.60 exists it’s 100DMA.

FX OVERVIEW​

USDJPY: Recent price action manages to climb above all the moving average at all time frames. Ahead of NFP (Friday) the price action likely to consolidate between 111.50 and 113.30.Supports moves to 112.20/112.00, 111.50 and 111.10/111.00.If propel above 113.30 further extensions could expect for 113.70 and 114.Medium term support remains at 109.50.

USDCAD:
As of now this week USDCAD gradually moving supports higher from 1.2420 to 1.2450. Today on early Asia session the pair is trading at 1.2565 a five-week low. Thursday’s Canada weak exports data further pressure the loonie.

Canada’s trade deficit totalled $3.4 billion in August, widening from a $3.0 billion deficit in July. Exports decreased 1.0% on lower volumes, while imports were unchanged.

Ahead of the September NFP today, it has a resistance at 1.26 above this 1.2660 and 1.2700 possible. The 20MA (weekly) seems at 1.2740. Intraday support finds at 1.2500, 1.2440 and 1.2400. Additional support finds at 1.2350. The bullish theme remains until 1.2440 holds.

USDCHF: USDCHF finally closed above 200DEMA after failing five sessions. Earlier resistance level acting as a potential support. 0.9770 was a key resistance level between mid-June 2017-August 2018 (below chart). Yesterday’s closing above 0.9770 was strong enough to extend further to 0.9830 and 0.9860 in between 20MA(monthly) seems at 0.9815. Supports move to 0.9750, 0.9640 and 0.9600. Medium-term potential support finds at 0.9550.

AUDUSD: AUD triggered a selloff after weak Retail sales on Thursday session. It has managed to hold the support 0.7780 again its 100DMA. It has a potential support zone remains between 0.7775 and 0.7750. Earlier resistance level acting as a potential support. 0.7750 was a key resistance level between Nov 2016-Mar 2017.

EURUSD
: EURUSD re-tested 1.17 after solid US data. The 2015 August low 1.1710 and fib reaction 23.6% finds at 1.1700 (Feb-August rally). Supports moved to 1.1710/1.1700, 1.1660 and 1.1600 it’s 50.0% fib (1.1100-1.2090 rally). Fails at 1.1660 mid-August low, open to 1.1610 May 2016 high coincides with 20MA (weekly)exists. The daily 100MAs finds between 1.1590-1.1575 and the Fib reactions, Feb-August rally 38.2% finds at 1.1500. Resistance seems at 1.1740, 1.1790/1.1800 and 1.1835/1.1850 its 20DMA.

NZDUSD: NZDUSD fell as low as 0.7110 taking out the 0.7130 August 31 low. A move below 0.7090 needed to forecast further retracement o 0.7050 and 0.7000. The 61.8 fib reaction finds at 0.7100 (mid-May – July). Weekly and daily ABC targets at 0.71. Resistance seems at 0.7150/0.7170, 0.7220 and 0.7250.

Gold: Fib reactions find at 1263 the 61.8%, coincides with 200DEMA and earlier swing high. The 200MA finds at 1252. Intraday resistance seems at 1275, 1280 and 1284. Potential resistance seems between 1288-1290 above this 1295/1296 exists. The daily oscillator turns bullish.

Platinum: Focus on the bottom of the range. Daily RSI oversold and oscillator turns bullish. Support zone remains between 900-890. Until the bottom of the range holds, could be rebound to 924/927 and 935. Fails at bottom of the range could retrace further to 870.

Brent: Brent oil has snapped the six-day straight fall and settles above 20dma. Parallel resistance seems at 57.25-57.30, Thursday high was 57.10 facing resistance at 50ma (H4). Above this 57.75 and 58.00 are the other potential resistance zone exists.

Supports move to 56.50, 56.20/56 and 55.50. A daily close below 56.00 needed to confirm a bearish H&S pattern (h4). On the daily chart, the RSI and the oscillator remain bearish

It is important to always keep in mind the risks involved in trading with leveraged instruments.

What is your Technical View?

Do you have a different idea? Please leave us a comment and get an answer from our professional analysts.
 
Brent spotted with bearish patterns.

  • September NFP came in at -33k, average hourly earnings increased to 2.9% y/y.
  • Payroll declines sharply in September due to bad weather.

Total nonfarm payroll employment was little changed in September (-33,000), after adding an average of 172,000 jobs per month over the prior 12 months. The unemployment rate decreased by 0.2 percentage point to 4.2 percent in September. The market focused on average hourly earnings rose 0.5% m/m basis and 2.9% y/y basis.

After a mixed NFP FX market reacted in line with our individual FX forecast. EURUSD and USDJPY appear an inverse co-relation and Gold and AUDUSD enjoy a healthy co-relation.

The AUDUSD, EURUSD, USDJPY, USDCAD, USDCHF, Gold and Brent were at decision levels before NFP hit the wires.

Support held:
AUDUSD held the support zone and closed at 0.7775.
EURUSD held the mid-August low 1.1660
Gold held the 8% fib (1204-1357)

Rejections:

USDCAD rejected at the weekly parallel resistance and near-term supply zone at 1.2600-1.2630
USDCHF rejected at 200MA(daily)
USDJPY rejected at the supply zone remains between 113-113.30
Brent rejected at the parallel resistance and formed a bearish H&S pattern (H4)
Before the NFP data, we advised bullish trades on AUDUSD and Gold. We retain the same themes to the midweek FOMC minutes.

We are adding USDSGD to our watch list. This week’s MAS policy meeting likely to produce a positive reaction on SGD. We are waiting for a dip or buying the breakout.

Chart of the week: Brent

BRENTDaily-2.png

Last week’s forecast: “A daily close below 56.00 needed to confirm a bearish H&S pattern (h4)” Friday closing 55.40.

It is important to always keep in mind the risks involved in trading with leveraged instruments.

What is your Technical View?
Do you have a different idea? Please leave us a comment and get an answer from our professional analysts.​
 
BRENT: We are watching at 53.80/53.50 and 50.00

After a sharp slide on last Friday, the brand new week open on a muted note. Brent oil prices rose marginally on Monday after OPEC comments indicating the possible deal extension.

Medium term: Before climbs to 59.50 (100.0fe daily) September high, the price action gave a bullish breakthrough major descending trend lines (blue lines in the below chart). We still believe the medium term bullish theme remains.

BRENTDaily-3.png

The recent ongoing correction is a healthy one to rebound 67$ (100.0 fe of 27-52.80-41.50). We presented a chart in our last two week’s Brent oil articles aiming at 67$. The daily RSI and oscillator remain bearish.

Near-term: Recent correction drags the price below 20MA (daily). As we forecast in our last Friday’s article the price action printed a bearish H&S pattern.

Supports moved to 54.50, 53.80 it’s 50DMA and 53.50 it’s 161.8% fe (53.80-50-59.50). A move below 53.50 needed to re-test the potential support zone 50-49.60. Resistance seems at 56.30, 56.80 and 57.30.

We are watching at 53.80/53.50 and 50.00 next two support levels. The ABC correction on the four-hour chart aiming at 53$ (below chart)

BRENTH4-1.png

View: Buy the dip sl 41.50 target 67 ((100.0 fe of 27-52.80-41.50)

It is important to always keep in mind the risks involved in trading with leveraged instruments.

What is your Technical View?

Do you have a different idea? Please leave us a comment and get an answer from our professional analysts.​
 
Wednesday FX overview.EUR and GBP crosses on a verge of fresh bullish breaks.

A broad dip in the US dollar lifts majors EUR and GBP 0.60% each and AUD rose 0.40%. Especially EUR and GBP crosses on a verge of fresh bullish breaks.

USD pairs retrace mildly on profit-taking. USDZAR and USDHUF down 0.90%, USDSGD and USDCHF down 0.60% each and USDCAD and USDJPY down 0.30% each
In the commodities space Gold rose 0.60%, Silver rose more than a percent, Platinum rose 2% and Copper rose 1.10%.
In the Agri commodity space US Cocoa rose 1.70%, Rough rice rose 1.60%, Live cattle rose 1.4% and Raw Sugar rose a percent.
In the energy space, Brent rose 1.60%, WTI rose 3% and Natural gas rose 1.70%.

News:

Spanish President of the Catalan Autonomous Region Puigdemont signed a document on “Declaring independence from Spain and suspending execution”. The media said that the relevant documents are still legally effective. (Related to EUR against USD and crosses).
Media: North American Free Trade Agreement (NAFTA) The fourth round of negotiations will be extended for two days to October 17.
Mexico Guajardo: active negotiations around the North American Free Trade Agreement (NAFTA). (Related to USDCAD and USDMXN)

FX Overview:​

Gold and Platinum rebound to our given target prices.

Brent facing resistance again at 57.30

EURUSD: Pause the extension at 20&50DMA between 1.1830-1.1850. Above this 1.19/1.1910 possible.

EUR crosses

EURAUD: Higher low pattern continues. We retain our 1.5300 target.

EURCHF: Potential resistance seems between 1.1525-1.1540. We retain out 1.18 target.

EURCAD: Facing resistance at 100DMA, 1.4800. We forecast a bullish reaction in the near term if propelled above 1.4830 aims at 1.4900/1.4920 and 1.4950. On the daily chart, the oscillator indicating a bullish H&S pattern. Supports move to 1.4720, 1.4630 and 1.4440.

EURCADH4.png

EURGBP: facing resistance at 0.90, intra-week range remains between 0.89-0.90/0.9050

EURJPY: Trading range remains between 133.20 and 131.70.

EURNZD: Break above Sep high. 1.69 is the next destination. We initiated a buy trade at 1.6450 last week.

GBPUSD: Re-tested 20WMA, resistance at 1.3270 above this 1.3350 possible

GBP crosses

GBPAUD: Near-term resistance seems at 1.70 and medium-term potential resistance seems at 1.7200.

GBPCAD: Bullish H&S formation in progress on the daily chart

GBPJPY: Weekly trading range remains between 146.50 and 150.10. A move below 146.50 needed to forecast 145.50 and 145.

GBPNZD: On a verge of a 420 pips trading range breakout. In this case, 1.8950/1.90 and 1.91 are possible. We initiated buying trade at 1.7940. It has been facing resistance at 100EMA(weekly)

GBPNZDH4-1.png

AUDUSD: Rejected at 0.7800. Further strength available if propel above. Support 0.7750/0.7730

NZDUSD: Consolidating at lower levels. Support at 0.7050 and 0.7000. NZ election remains. We believe limited downside risk.We are watching at 100MA(weekly).

USDCAD: Support remains at 1.2440 below this 1.2400 exists.

USDJPY: Support finds at 111.40 and 111.00

USDMXN: Facing resistance at 200DMA

USDZAR: Facing resistance at early April high 13.95. It has achieved all our given targets.

Copper rebound 61.8% of the recent fall.

New trade ideas:

EURCAD:Facing resistance at 100DMA.

GBPCAD: Bullish H&S formation in progress. We will update once the trend

GBPCADDaily.png


It is important to always keep in mind the risks involved in trading with leveraged instruments.

What is your Technical View?

Do you have a different idea? Please leave us a comment and get an answer from our professional analysts.​
 
EURAUD: keeping the North momentum. Further bullish reaction expected.

EUR is the winner again in the second consecutive day against USD and cross as well.

EURAUD keeping the North momentum for the fifth straight day closed tad above June high 1.5227. Recent price action lifted the support base from 1.4730 to 1.4790.

Before climbed to 1.5240, 38.2% fib reaction (Oct 2008 high- August 2012 low) it has erased the two-year descending trendline and. We have been recommending buying ever since we spotted a bullish H&S pattern on the daily chart in August, aiming at 1.5330.

The same pattern extended to weekly chart as well. The near-term extension has a potential resistance seems at 1.5330 mid-Dec 2014 high above this 1.5450 exists. The daily RSI and oscillator appear little overbought (below chart).

EURAUDDaily-1.png

In the medium term perspective, if settles above 1.5330 the weekly inverse H&S pattern (below chart) aiming at 1.5400, 1.5530, 1.5600/1.5650,1.5860 and 1.6000.

EURAUDWeekly.png

In the longer term view, we wouldn’t fade this on the assumption that we are forming a right-hand shoulder on the monthly chart (below chart).

EURAUDMonthly.png

It is important to always keep in mind the risks involved in trading with leveraged instruments.

What is your Technical View?

Do you have a different idea? Please leave us a comment and get an answer from our professional analysts.
 
Friday FX technicals

  • EURUSD: Forming a right-hand shoulder
  • GBPUSD: Resistance between 1.3290-1.3340
  • NZDUSD: Facing resistance at the neckline
  • AUDUSD: 0.7810 is the weekly pivotal
  • USDJPY: Remains between 111.00 and 113.45
  • USDMXN settles above 200MA
  • USDCHF: Potential resistance seems between 0.9850-0.9865
  • USDCAD: The NAFTA negotiations establish headline risk to CAD.

Event risk: Inflation data from US (Friday) is the key risk event highlighting.

Fri, Oct 13
US CPI

Barclays: We forecast headline CPI at 0.6% m/m and 2.3% y/y in September. For core CPI, we forecast readings of 0.2% m/m and 1.8% y/y.

EURUSD continues the rebound from NFP low 1.1665, erases 50.0 % of the previous losses. It has a potential resistance seems between 1.1880 and 1. 1910.We believe it will fail at the higher end of the falling channel. Earlier, it has erased the five-month ascending trendline.

Today in Asia session, it manages to hold the 20MA. We wouldn’t fade this on the assumption that we are forming a right-hand shoulder on the daily chart. If propels above the left shoulder, opens to 1.20. Fails to break, 1.1840 is the key to open 1.1780 and 1.1730.

EURUSDDaily-1.png

GBPUSD continues to see a rebound from last week’s low 1.3025. It has a parallel resistance seems at 1.3290 above this 1.3330 it’s 20MA exists. A further uptrend could expect it settles above 1.3340 (50.0% 1.3655-1.3026 fall) in this case, 1.3400/1.3415 it’s 61.8% expected.

Supports move to 1.3220, 1.3120 and 1.3020/1.3000. The daily oscillator appears bullish.

GBPUSDDaily.png

USDJPY: Recent price action remains between 112 and 113.45. Ahead of today’s CPI data trading range remains between 111.00 and 113.45. The daily RSI is sloping and the oscillator remains bearish. Supports moves to 111.50, 111.10/111.00 and 110.00
If propel above last week’s high further extensions could expect for 113.70 and 114.50 initially. Medium term support finds at 109.50.
View: Buy the dip.

USDMXN settles above 200MA, marching towards [email protected] >19.50 cmp 18.91. We initiated a buy trade in August at 17.85.
View: Take profit

USDCHF rejected at 200DMA last week. Intraday resistance moved down to 0.9765 from 0.9835. Supports move to 0.9700, 0.9640 and 0.9550.
Potential resistance seems between 0.9850-0.9865 a weekly close above this could open to 0.9950 and 1.00. We believe after re-testing between 0.9620-0.9550 the cross again lifts the nose 0.9850.
View: Buy the dip

USDCAD lifted by a positive divergence on the daily chart. It has a support finds at 1.2410/1.2400 breach open to 1.2330 and 1.2270. The near-term trend remains up to 1.2660 and 1.2700. Ahead of today’s CPI data from the US and Canada trading range remains between 1.2390 and 1.2550. The NAFTA negotiations establish headline risk to CAD.

View: Neutral

It is important to always keep in mind the risks involved in trading with leveraged instruments.

What is your Technical View?

Do you have a different idea? Please leave us a comment and get an answer from our professional analysts.
 
Brent: Medium trend outlook remains bullish

Crude oil rose 0.80% in Monday Asia trade. Market news “The Iraqi army began to Kurdish control of Kirkuk advance”. IEA said on last Thursday, Global Oil market seen balanced in 2018.

WTI is trading at 51.85 and Brent at 57.67 (11.40AM AEDT time).

Before the Brent climb to 57.68, it has given a breakthrough inverse H&S pattern on Friday session. We forecast the pattern before( Friday) it gave a break through the neckline (H4), targets at 57.50 and 57.75.

Last week’s price action moves the support the higher from 55 to 55.75.

Resistances seems at 57.80/58, 58.60/59 and 59.70/60.0.

The medium trend outlook remains bullish as it has broken above the key descending trendline.

BRENTDaily-5.png

Week ahead trading range remains between 60-54.80.

BRENTH4-2.png

It is important to always keep in mind the risks involved in trading with leveraged instruments.

What is your Technical View?

Do you have a different idea? Please leave us a comment and get an answer from our professional analysts.​
 
EURGBP: UK Domestic data in focus this week

The cross remains in a tight range ahead of upcoming UK economic data this week. Better than expected data outcomes would strengthen the case of Bank of England hiking interest rates in Q7 2017.

The near and medium term price action remains on economic and political events. Inflation, employment data, and retail sales are the key drivers/risk events to the GBP this week. Central bank’s policy changes are the key drivers in the medium term. ECB press conference on Oct 26 (Thu) and Mega Thursday (Nov 02).

Besides, BREXIT headlines and BoE’s Carney, Ramsden and Tenreyro testify to lawmakers in London (Tue) continue to add further risk to GBP. If market hints further hawkish tone, the upside risk to the GBP could continue to the November BoE meeting.

FX positioning: According to Oliver Harvey and Robin Winkler at Deutsche Bank “Amid heightened Brexit uncertainty, investors trimmed their GBP longs considerably while extending their long positioning in EUR for the third week, taking it to its highest levels since May 2011”.

Upcoming data:

Tue, Oct 17
UK CPI

Nomura: We forecast a further rise in CPI inflation to 3%, though the risks may be on the upside

Barclays: We forecast that CPI will print at 3% y/y

UK PPI

Nomura: We expect a 0.2% m-o-m increase in the core measure, but a larger 0.4% m-o-m rise in the headline thanks to a rise in fuel prices during the month.

Wed, Oct 18
UK labor market report
Nomura: We would once again suggest focusing on the monthly change in private sector regular pay to avoid base effect issues associated with the headline (3mma % y-o-y) earnings data. Monthly growth has averaged just over 0.2% in the past six months, or around 2.6% annualised.

Barclays: we expect weekly earnings to have increased 2.1% 3m/y (Wednesday; consensus: 2.1%; previous: 2.1%), while unemployment should be unchanged at 4.3% (Wednesday; consensus: 4.3%)

Thu, Oct 19
Retail sales

Nomura: The CBI and BRC measures of retail sales reported notable recoveries in growth in September, suggesting an upbeat official print.

TECHNICAL VIEW

We still believe EURGBP is on a verge of making a lower high pattern. The recent corrective rally likely to end between 50.0%-61.8% fib reactions. The 50.0% fib seems at 0.9050, 61.8% at 0.9090 and 80.0% at 0.9200.

In yesterday’s session, the cross manages to hold the 20DMA, coincides with the 61.8% fib reaction (0.8745-0.9030).

A move below 0.8840 needed to forecast 0.88/0.8790 and 0.8750. A daily close below could confirm the lower high pattern, aiming at 0.8470 and 0.8300 levels.

Alternate scenario, if settles above 0.9050 open to 0.9090, 0.9140 and 0.9200. The daily Oscillator remains bearish.

EURGBPDaily-1-1.png

View: Sell the breach

It is important to always keep in mind the risks involved in trading with leveraged instruments.

What is your Technical View?

Do you have a different idea? Please leave us a comment and get an answer from our professional analysts.
 
EURUSD: ECB speeches in focus

Ahead of the ECB meeting (Oct 26, Thu) FX traders are watching a number of ECB speeches this week by Draghi, Praet, Coure, and Constancio. Any hawkish hint from the ECB speeches should support the EUR again. On an EZ data perspective, we have Sep Final CPI reading and German ZEW index.

This week’s ECB speeches and next week’s ECB policy meeting could set the price range.

FX positioning: According to Oliver Harvey and Robin Winkler at Deutsche Bank “Leveraged funds extended their long EUR exposure by a quarter while asset managers added to their longs only moderately”.

Speeches:

Wed, Oct 18

ECB President Draghi & Executive Board Members Praet and Coeuré speak at the ECB Conference in Frankfurt, Germany.

TECHNICAL VIEW​

EURUSD little changed to the downside as Euro & Dollar Struggle to find direction in Monday session. Before retracing to 1.1780 it was spotted with a double top at 1.1880 at its 50.0% fib (1.2090-1.1665 fall) above this 1.1910 earlier swing high exists.

It has a potential resistance zone seems between 1.1880-1.1930 it’s 61.8% fib reaction. We wouldn’t fade this on the assumption that we are forming a right-hand shoulder on the daily chart. If propels above the left shoulder/1.1930, opens to 1.20.

As we forecast in our Friday’s article (Oct 14) it has failed at the higher end of the falling channel (below chart) and retraced more than 61.8% (1.1665-1.1880). Potential supports finds between 1.1730/1.1700 and 1.1660.

EURUSDH4.png

On the daily chart, the neckline is found at 1.1660 below this 100MAs finds between 1.1630-1.1620. A weekly close below 1.1600 we believe near-term retracement could extend to 1.1500/1.1465 and 1.1420.

EURUSDDaily.png

The daily and the weekly oscillators remain bearish.

View: Waiting for a clear picture.

It is important to always keep in mind the risks involved in trading with leveraged instruments.

What is your Technical View?

Do you have a different idea? Please leave us a comment and get an answer from our professional analysts.​
 
Ahead of the ECB meeting (Oct 26, Thu) FX traders are watching a number of ECB speeches this week by Draghi, Praet, Coure, and Constancio. Any hawkish hint from the ECB speeches should support the EUR again. On an EZ data perspective, we have Sep Final CPI reading and German ZEW index.

This week’s ECB speeches and next week’s ECB policy meeting could set the price range.

FX positioning: According to Oliver Harvey and Robin Winkler at Deutsche Bank “Leveraged funds extended their long EUR exposure by a quarter while asset managers added to their longs only moderately”.

Speeches:

Wed, Oct 18

ECB President Draghi & Executive Board Members Praet and Coeuré speak at the ECB Conference in Frankfurt, Germany.

TECHNICAL VIEW​

EURUSD little changed to the downside as Euro & Dollar Struggle to find direction in Monday session. Before retracing to 1.1780 it was spotted with a double top at 1.1880 at its 50.0% fib (1.2090-1.1665 fall) above this 1.1910 earlier swing high exists.

It has a potential resistance zone seems between 1.1880-1.1930 it’s 61.8% fib reaction. We wouldn’t fade this on the assumption that we are forming a right-hand shoulder on the daily chart. If propels above the left shoulder/1.1930, opens to 1.20.

As we forecast in our Friday’s article (Oct 14) it has failed at the higher end of the falling channel (below chart) and retraced more than 61.8% (1.1665-1.1880). Potential supports finds between 1.1730/1.1700 and 1.1660.


On the daily chart, the neckline is found at 1.1660 below this 100MAs finds between 1.1630-1.1620. A weekly close below 1.1600 we believe near-term retracement could extend to 1.1500/1.1465 and 1.1420.


The daily and the weekly oscillators remain bearish.

View: Waiting for a clear picture.

It is important to always keep in mind the risks involved in trading with leveraged instruments.

What is your Technical View?

Do you have a different idea? Please leave us a comment and get an answer from our professional analysts.​
My concern with the ecb is they have stated they are kicking tapering down the road to January and also said they will continue with QE until notice. Also there are issues stirring in Europe with uncertainty over Austria but more importantly Spain, who are in breach of the convergence criteria with 17 percent unemployment and struggling with growth. The government have to increase taxes or spend less in a time when they need to spend more. Added to the Spain mix is catalonia uncertainty. If they raise rates it's going to further increase the exchange rate who will further exasperate Spains problems. Probably a crisis looming for next year but on the cards nonetheless.
 
Top