You are using an out of date browser. It may not display this or other websites correctly.
You should upgrade or use an alternative browser.
You should upgrade or use an alternative browser.
natureboy
Established member
- Messages
- 770
- Likes
- 2
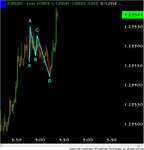
EURUSD ran into a symmetrical triangle on 5m. Further time targets are 1030 and 1220.. Waiting for some more upside.. Have my individual entry stops at 1.2972; 1.2961 for the Bull ID
I'm long again, average price 1.2985. Had avg price from 1.2935 eariler... This experience today has reminded me of something i learned previously regarding whipsaw price action & the time model i use. At that first time target at 530, there was a down move from 400 as expected, then the push up at 530.. That often happens when entering a correction concurrent with the trend tool saying bearish.. Its tough, there's no easy solution for me b/c the strength meter i also use was bearish, so my trading rules had be bearish for that moment.. Win some, lose some.
I'm long, waiting for fast pop to 1.3000 area.. we'll see if that happens... real sluggish around this breakout so far
Last edited:
natureboy
Established member
- Messages
- 770
- Likes
- 2
Good Morning Folks
I have some kind of bug, going around my home town. Everyone seems to have this thing.. Yuck. On the EURUSD -
Check out the 4hr 50/200 SMA:

If price can get down to 1.2860, look for a bounce. Below the 200, below 1.2800, and I would be much closer to abandoning the whole bullish continuation view.
Chart Pattern-wise:
Hourly Head&Shoulders

In my testing, i've found the Head High to Lowest Low in the Shoulder gives good projected targets. however, the better target is not always the 100% of that H-L range, i've found the 62% to be better.. So -> this targets the zone of 1.2877-1.2851 for completion of the down swing on the hourly, which of course is in line with the 4hr 200 SMA support hypothesis also.

USD news at 830 EST, may coincide with a support or reversal.
I have some kind of bug, going around my home town. Everyone seems to have this thing.. Yuck. On the EURUSD -
Check out the 4hr 50/200 SMA:

If price can get down to 1.2860, look for a bounce. Below the 200, below 1.2800, and I would be much closer to abandoning the whole bullish continuation view.
Chart Pattern-wise:
Hourly Head&Shoulders

In my testing, i've found the Head High to Lowest Low in the Shoulder gives good projected targets. however, the better target is not always the 100% of that H-L range, i've found the 62% to be better.. So -> this targets the zone of 1.2877-1.2851 for completion of the down swing on the hourly, which of course is in line with the 4hr 200 SMA support hypothesis also.

USD news at 830 EST, may coincide with a support or reversal.
natureboy
Established member
- Messages
- 770
- Likes
- 2
So -> prior to the Swiss release, EURUSD is moving up some. Overall, i've got what constitutes a trade signal from my day system, so i'm going to go ahead and automate longs. The first trade of the week often fails, so i'm expecting a reversal back down - rules call for entering now, and i can't tell the future - so, automating longs..
natureboy
Established member
- Messages
- 770
- Likes
- 2
probably shoulda woulda coulda taken profits at 1.2966 in light of that time target.. This cold/bug/sniffles has me 'dumb enough' to follow rules i know work.. which in a weird way i'm grateful for. Long bias at 1.2948. Strength in a position for a short trade, below that price, i'll be going short.. may lead to whipsaw.. we'll see.
Last edited:
natureboy
Established member
- Messages
- 770
- Likes
- 2
natureboy
Established member
- Messages
- 770
- Likes
- 2
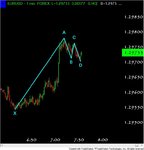
its going to take some crazy upside volatility to make my target happen.. getting closer to 730, and the strength is bearish.. which can happen during a correction in good bull trend.. as i type it made new highs. 1.2978-1.2990 is a good profit taking area folks
Similar threads
- Replies
- 35
- Views
- 10K
- Replies
- 75
- Views
- 18K


