Joey's MP Journal

Status
Not open for further replies.
Joey,

Been busy but I wanted to check in and see what you were up to. First off, I'm assuming you got the 5-day overlay idea from Cisco? That's fine but I have come to the conclusion that this particular idea is very circumstantial. It's so much more viable to dynamically build the merge on demand. So, at one point you may be using a 5 day overlay and another day you may be using a 3 day or maybe a 4.5 day overlay. Other times you won't even be using an overlay because the market is currently in discovery when you do your homework. My main work detailing splits, merges & counter trend trades is based upon this.

As for your one trade today. I'm not sure how you managed it. I, in fact, took the same trade (more or less) and ended up with a decent sized profit on it. It wasn't anything to write home about, but it was a winner. It was helluva tough trade to take too but it worked out OK. No big follow through to work runners but a decent "scalp."

I'm curious why you didn't jump on the move up today?

I'll try to keep checking in to see now you're doing when I have time. As always, if you want to chat, please feel free to be in touch.

Take care,

Frank
 
Split/merged profiles are the evolution of MP, but I think many institutions/traders who use MP for their trade still look at daily/weekly/monthly profiles.
 
Joey,

Been busy but I wanted to check in and see what you were up to. First off, I'm assuming you got the 5-day overlay idea from Cisco? That's fine but I have come to the conclusion that this particular idea is very circumstantial. It's so much more viable to dynamically build the merge on demand. So, at one point you may be using a 5 day overlay and another day you may be using a 3 day or maybe a 4.5 day overlay. Other times you won't even be using an overlay because the market is currently in discovery when you do your homework. My main work detailing splits, merges & counter trend trades is based upon this.

As for your one trade today. I'm not sure how you managed it. I, in fact, took the same trade (more or less) and ended up with a decent sized profit on it. It wasn't anything to write home about, but it was a winner. It was helluva tough trade to take too but it worked out OK. No big follow through to work runners but a decent "scalp."

I'm curious why you didn't jump on the move up today?

I'll try to keep checking in to see now you're doing when I have time. As always, if you want to chat, please feel free to be in touch.

Take care,

Frank
Frank,

Good to hear from you.

Because I'm using an all-in, all-out strategy the trade management is designed so that I trail behind the entry level once the trade is onside a decent amount. Therefore the -4 loss.

I was just a couple of ticks from tightening the stop right up close, but the 1259.00 proved difficult to overcome. I'm aiming to get more out of the winners, like you and others have suggested, so I'm not too worried.

Since there's an asymmetry between long and short strategies in the equity markets, I'm using a short-only strategy at first. Plus it enables me to get in the queue quickly, and since a lot of these ideas don't even go past by a single tick that's quite important.

So in essence, it's a forward-tested project holding several variables constant and trying to identify the key value drivers. Even though I'm not trading them, I'm observing the signals in reverse and watching the long side intently.

I've come to the conclusion that the merge side is where the pioneering work is being done by yourself, Steidlmayer and others, so this is probably running before I can walk!

Regards,
Joey
 
Split/merged profiles are the evolution of MP, but I think many institutions/traders who use MP for their trade still look at daily/weekly/monthly profiles.

Hello Gordon,

Do you use MP in your trading?

I'd be interested to hear which concepts you're using.

Joey
 
Key Numbers EPU8 for use July 23rd

Anticipated Resistance Levels
1351.75
1343.25
1328.75
1316.75
1308.00
1300.50
1290.75
1280.00

Daily Pivot Point: 1266.50

Daily Point of Control: 1260.25
 
Hi Joey,

I use classic Market Profile basic levels to trade: POC and Value Area levels, plus high/low of the previous day ... nothing special.

Frank suggestion is good, didn't want to sound critic, but I know of many ways of using MP to trade.

Just ask yourself: what kind of help can MP give me ? Can it supports me in viewing the market's condition (trend/congestion)? Can it help me in developing scenarios ? Can it help me in providing supports/resistances ? What do I need in order to integrate my candlesticks analysis (or whatelse you use) ?
 
23rd July 1st Order

First trade is likely to be:

Sell limit at 1283.00
Stop at 1286.00
Target at 1279.00

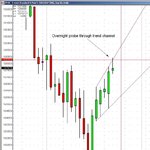
I believe in the overnight session there was a failed auction through a developing trend channel, and that's what the selling tail is telling us (see chart)
 

Attachments

  • 23rd July.JPG
    23rd July.JPG
    84.9 KB · Views: 126
Hi Joey,

I use classic Market Profile basic levels to trade: POC and Value Area levels, plus high/low of the previous day ... nothing special.

Frank suggestion is good, didn't want to sound critic, but I know of many ways of using MP to trade.

Just ask yourself: what kind of help can MP give me ? Can it supports me in viewing the market's condition (trend/congestion)? Can it help me in developing scenarios ? Can it help me in providing supports/resistances ? What do I need in order to integrate my candlesticks analysis (or whatelse you use) ?

Cheers Gordon,

I guess that's why most practitioners are loathe to have it viewed as a "system". More of a way of understanding the market's auction process.

Joey
 
End of Day July 23rd

Sold at 1283.00
Stop at 1286.00
Exit at 1286.00
Gross p/l = -3.0

Well that's what you get if you don't stick to your plan.
Attempted a trade not on my list and got my due reward.
 
Gordon, no worries my friend. I don't get upset at other ideas. I'm just expressing my feelings toward multi-day profiling and how I found use in them which has shown success for me.

Joey, the one thing you might want to take a look at, is the use of the 24 hour profile. There were two areas of rotation today that were very evident coming into the open and I think it would have saved you from executing the trade you did. I use the 24 hour profile exactly the same as normal, splitting and merging the profile to dynamically construct the activity, but including the overnight balance areas in the mix. The first thing I look at when I sit down is the overnight market because it could easily throw your night time homework to hell and make it completely irrelevant.

Again, this last bit is my personal way of manipulating things but it has proven to be a very positive step in my profiling work. My work continues to push in directions which are rather un-tapped because I try very hard to keep my methods off the beat and path as I always have felt that the more different I am from everyone else, the better off it is for me.

Take care,

Frank
 
Hi Frank,

I like the idea of profiling the Globex night session ... I will give it a try, thanks for the input.
 
Gordon, no worries my friend. I don't get upset at other ideas. I'm just expressing my feelings toward multi-day profiling and how I found use in them which has shown success for me.

Joey, the one thing you might want to take a look at, is the use of the 24 hour profile. There were two areas of rotation today that were very evident coming into the open and I think it would have saved you from executing the trade you did. I use the 24 hour profile exactly the same as normal, splitting and merging the profile to dynamically construct the activity, but including the overnight balance areas in the mix. The first thing I look at when I sit down is the overnight market because it could easily throw your night time homework to hell and make it completely irrelevant.

Again, this last bit is my personal way of manipulating things but it has proven to be a very positive step in my profiling work. My work continues to push in directions which are rather un-tapped because I try very hard to keep my methods off the beat and path as I always have felt that the more different I am from everyone else, the better off it is for me.

Take care,

Frank

By the way, I am profiling the overnight session. These levels are all key historical overnight levels on my list:

1351.75: 18th June overnight
1343.25: 20th June overnight
1316.75: 26th June overnight

All based on split profiles from the CBOT handbook. In fact all my work is based on that.

Even the impluse trade today was based on the overnight session and what I saw as a failed auction above a developing trend channel.
 
Last edited:
Just going to have some fun from now on.

I've decided I don't know my a*se from my elbow when it comes to daytrading.

Instead I'm going to try to have some fun and have a good rush from the occasional winner. Unashamed gambling - something to relieve the monotony of my normal trading day.

Anyway, I've been keeping a blog, and the method is now to identify potential turning points for shorting using a mixture of Market Profile and Classical Pivot Points.

Today's levels are:

1352.08 (Weekly R3)

1343.25 (Resistance)

1328.75 (Resistance)

1316.75 (Resistance)

1308.08 (Weekly R2)

1300.50 (Resistance)

1280.92 (Weekly R1)

1274.00 (Daily Pivot Point)

1264.08 (Weekly Pivot Point)

Joey
 
Pivot Point Guide

I'm using the following scheme (there are many variants).

R3 = Pivot Point + (2 x Range)

R2 = Pivot Point + Range

R1 = (2 x Pivot Point) - Low

Pivot Point = (H + L + C) / 3

S1 = (2 x Pivot Point) - High

S2 = Pivot Point - Range

S3 = Pivot Point - (2 x Range)

Last week for the e-mini S&P Sep contract we had:

H = 1291.25, L = 1247.25, C = 1253.75, Range = 44.00, giving:

R3 = 1352.08
R2 = 1308.08
R1 = 1280.92
PP = 1264.08
S1 = 1236.92
S2 = 1220.08
S3 = 1176.08

Joey
 
I've decided I don't know my a*se from my elbow when it comes to daytrading.

personally i think that's a wee bit a' ****e and an utter cop out.
from the little i know of U , u seem to be intelligent, smart and a cut above the rest.

but i'm disappointed at your reaction, maybe this is why "95%" of traders fail - because they give up, bored or disilusioned.
as i've said before, trading is supposed to be boring, so if it's not exciting you, it seems to me you're not doing too bad ...
 
Provisional Levels List

1377.58 (Weekly R3)

1343.25 (Resistance)

1328.75 (Resistance)

1319.08 (Weekly R2)

1316.75 (Resistance)

1300.50 (Resistance)

1289.67 (Weekly R1)

1262.75 (Daily Pivot Point)

1260.58 (Weekly Pivot Point)

1247.00 (Support)

1231.17 (Weekly S1)

1227.25 (Support)

1202.08 (Weekly S2)

1143.58 (Weekly S3)

Numbers checked and OK.
 
Last edited:
trading is supposed to be boring ...

One of the first things I say to beginners or people who ask about trading is..."It's pretty boring actually."

"Methodical" is probably a better word but to an outsider, watching "methodical" in action is likely to be boring.

I once heard trading described as "Hours of boredom injected with short periods of manic activity" or something like that. Even the short periods of activity become less manic as time goes on and I prefer it that way.

To me, boring = consistency and sustainability.
 
I don't really think Joey has indicated that the problem is that trading is "boring" or what-not. Day trading isn't for everybody and I think he's just decided that it isn't for him, except for the occasional leisurely "bet" here and there. I don't necessarily believe in what he's gone with either, but you have to respect a person's decision to do what they feel is right.

Day trading is not an easy thing to do. And I agree with you completely that it truly is rather boring. I deal with this every day as an educator who tries hard to stress this fact to people all the time.

Anyway, Joey I wish you the best of luck. My email inbox is always open to you.

Take care.
 
Level List for use Aug 5th

9.00am (Chicago) : ISM Non-Manufacturing
13.15pm (Chicago) : FOMC Interest Rate Decision

1377.58 (Weekly R3)

1343.25 (Resistance)

1328.75 (Resistance)

1319.08 (Weekly R2)

1316.75 (Resistance)

1300.50 (Resistance)

1289.67 (Weekly R1)

1262.25 (Resistance)

1260.58 (Weekly Pivot Point)

1258.75 (Resistance)

1252.75 (Daily Pivot Point)

1231.17 (Weekly S1)

1227.25 (Support)

1202.08 (Weekly S2)

1143.58 (Weekly S3)
 
Levels for use 6th August

1377.58 (Weekly R3)

1343.25 (Resistance)

1328.75 (Resistance)

1319.08 (Weekly R2)

1316.75 (Resistance)

1300.50 (Resistance)

1289.67 (Weekly R1)

1276.00 (Support)

1271.58 (Daily Pivot Point)

1260.58 (Weekly Pivot Point)


1231.17 (Weekly S1)

1202.08 (Weekly S2)

1143.58 (Weekly S3)
 
Status
Not open for further replies.
Top