Joey's MP Journal

Status
Not open for further replies.
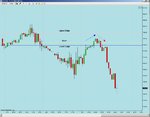
With regard to the setup last night, price rotated completely through Balance Area 2, and then closed on the H4 above it.

Using the rule that once an area has been "rejected" within a session, any subsequent pullback is likely to stall either at the edge or the mean, TPs were adjusted to the mean of Balance Area 2.

Upon being filled with a Lower Edge order, price did retrace to the mean (to the exact pip!) @ 1.4235, giving a profit of 93 pips on that trade.

The other limit order has been filled since, and is currently about 35 pips down. Price eventually found resistance near the Upper Edge of Balance Area 1.

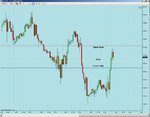
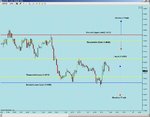
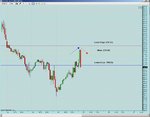
Meanwhile, I see there being just the one balance area for the start of next week:

Upper Edge: 1.4374
Mean: 1.4274
Lower Edge: 1.4246
 
S&P500 Daily Future (Monday)

"Mean Rotation" Trade

Sold @ 780.90
Bought @ 745.00

P/L = +35.90
 

Attachments

  • MeanRotation.jpg
    MeanRotation.jpg
    71 KB · Views: 138
  • ticket.jpg
    ticket.jpg
    33 KB · Views: 137
Nice trade!! Could you elaborate this mean rotation a bit more? Mean = yesterday's mean?

Hi Leovirgo,

It's a time-at-price rather than a volume-at-price mean. It's more a visual method, looking for "clusters" of congestion, with the areas divided by areas of low volume (or should I say areas where price didn't spend too long). They can stretch across days or have more than one in a single day etc.

The "rotation" bit simply means the natural tendency of price to pause for a while around the mean (as a price attractor), and rotate back and forth for a while when it re-enters these areas.
 
S&P500 Daily Future (Tuesday)

Mean Trade

Sold @ 765.1
Bought @ 768.4
P/L = -3.3

Price moved into the balance area, stalled at the upper edge and retraced back towards the mean. It would therefore appear that the market has "accepted" this balance area.

Since the odds favour choppy price action around this mean (characteristic of a market in balance), I won't be trading the S&P tomorrow.
 

Attachments

  • Acceptance.jpg
    Acceptance.jpg
    76.9 KB · Views: 145
Portfolio FX

I plan to place a number of trades tonight according to the following rules:

Pairs to be traded

The "majors":

USDCHF, GBPUSD, EURUSD, USDJPY, AUDUSD and USDCAD

Trades to be taken

Limit orders at the edge and at the mean in markets which are "out of balance".

Portfolio Assumptions

(i) For simplicity, capital is allocated as if a position is taken in each pair.
(ii) Independence is assumed (i.e no covariance).
(iii) Dollar-funded account.

----------​

I have calculated the following risk-adjusted weights for use tonight, with Yen normalised to $1000 risk:

USDJPY $1000
AUDUSD $479
USDCHF $433
EURUSD $425
USDCAD $339
GBPUSD $336

In practical terms, this means that if 1 standard lot is traded for USDJPY, then 2 lots are traded for AUDUSD and 3 lots are traded for GBPUSD etc.

The sum of the risks can then be set to x% of account size.

This is very much "experimental", and is still using a demo FX account.
 
I've put in orders for 4 of the pairs as follows:

GBPUSD

Sell 1.5 lots Limit @ 1.4476
Sell 1.5 lots Limit @ 1.4553

USDCHF

Buy 1.2 lots Limit @ 1.1673
Buy 1.2 lots Limit @ 1.1597

USDJPY

Buy 0.5 lots Limit @ 95.668
Buy 0.5 lots Limit @ 94.568

USDCAD

Buy 1.5 lots Limit @ 1.2503
Buy 1.5 lots Limit @ 1.2455
 

Attachments

  • gbpusd.gif
    gbpusd.gif
    9.3 KB · Views: 141
  • usdchf.gif
    usdchf.gif
    10.6 KB · Views: 158
  • usdjpy.gif
    usdjpy.gif
    8.2 KB · Views: 156
  • usdcad.gif
    usdcad.gif
    11 KB · Views: 152
I got complete fills in USDCHF and USDCAD.

USDCAD passed through and closed beyond the balance area, leading to TPs set at a pullback to the mean.
This occurred for (-23 + 25) = +2 pips.

USDCHF was a success, but midway through the afternoon I closed the position at the mean. The level of work required to prepare these profiles (especially with Mickey Mouse money) is too time consuming.

Instead, I'll be experimenting with fades at areas of Minus Development (see post #14) for FX, which at a glance appears to work well.

For the live account (S&P500 futures), I'll stick with the Balance Area approach, which is working fine.
 
USDJPY (Minus Development)

Good, I've been filled in a USDJPY trade:

Sold 1.5 lots Limit @ 98.11
Exit 1.0 lots Limit @ 97.78
Exit 0.5 lots @ "runner"

The first target has been filled for 1.0 x 33 pips profit.

The chart illustrates the Minus Development - 2 areas of congestion separated by a spike bar.
 

Attachments

  • usdjpyminus.gif
    usdjpyminus.gif
    10.3 KB · Views: 139
AUDUSD (Minus Development)

Same setup in AUDUSD:

Sold 1.5 lots Limit @ 0.6424
Exit 1.0 lots @ 0.6396
Exit 0.5 lots @ "runner"

Have been filled at the first target for +1.0 x 28 pips.
 

Attachments

  • audusdminus.gif
    audusdminus.gif
    9.1 KB · Views: 136
Last edited:
EURUSD (Minus Development)

Sold 1.5 lots Limit @ 1.2690
Exit 1.0 lots @ 1.2653
Exit 0.5 lots @ "runner"

Have been filled at the first target for +1.0 x 37 = 37 pips
 

Attachments

  • eurusdminus.gif
    eurusdminus.gif
    9.1 KB · Views: 147
These all worked well, except a poor GBPUSD trade which lost 105 pips.

It appears that historical levels are more potent than intraday levels, and attention needs to be paid to optimal exits. This one is a real headache, because if an exhaustion approach or a trailing approach is used, the exits or trails could well get triggered in the Asian session.

With this in mind, I've decided to start on the Daily chart (which is probably easier anyway) and address the following problems:

(1) Volatility or Technical stop?

(2) Exits: all-in / all-out or scaled out?

(2ii) Exits: target based, exhaustion based etc. ?

This really calls for an extensive study, and so I'll be doing 5 years of testing on the Majors. I know from having done this painful and laborious process with index options trading that not only do the results give you the confidence to pull the trigger with real confidence, but they also give you a good idea for appropriate leverage, risk of ruin, and so on.
 
The Method Being Tested

Further to the previous post, I have decided on the method to be tested.

Conditional on a market meeting certain bracketing criteria,

Price enters an alert zone, where a decision is made as to whether:

(a) a breakout trade is entered
or
(b) a responsive trade is entered

Targets for the breakout trade are open-ended, but could be set equivalent to the responsive trade targets.

Targets for responsive trades are at the mean / centre of the bracket.

Example: GBPUSD

For the week ahead, the Bracket Parameters are:

Upper Bracket Limit: 1.4605
Responsive Short: 1.4549

Responsive Trades Target: 1.4383

Responsive Long: 1.4216
Bracket Lower Limit: 1.4160

Note: Brackets appear to make sense at the 5-day, 10-day, 20-day levels. Whether these are computed on a calendar or rolling basis is open to debate, but I will be using calendar.
 

Attachments

  • Cable Bracket.jpg
    Cable Bracket.jpg
    83.5 KB · Views: 157
Cable Balance Breakout

The bracket breakout method works under the assumption that the best breakouts are preceded by a period of balance, preferably a small area.

Looking at GBPUSD, the 10-day range doesn't quite look balanced, with a bias or build up of value to the downside. However, the 5-day range just about satisfies bracketing criteria, with price rotating relatively uniformly throughout the range.

I have entered a short breakout trade, with 2/3 of the postion covered for 85 pips profit. The target for the remainder is at 1.3904. Nothing very sophisticated with the trade management - either the target or the stop is hit, otherwise manual close late Friday.
 

Attachments

  • gbpusd.gif
    gbpusd.gif
    9.6 KB · Views: 139
Still in it. Heartened by the way price today turned at yesterday's entry (the bottom of the previous week's bracket).

However, the backtesting I'm currently conducting has shown that it was fortunate that last week finished with price in a range - it can just as easily break out on a Tuesday or a Wednesday :LOL:
 

Attachments

  • cableupdate.gif
    cableupdate.gif
    10.3 KB · Views: 140
Further to the previous post, I have decided on the method to be tested.

Conditional on a market meeting certain bracketing criteria,

Price enters an alert zone, where a decision is made as to whether:

(a) a breakout trade is entered
or
(b) a responsive trade is entered

Targets for the breakout trade are open-ended, but could be set equivalent to the responsive trade targets.

Targets for responsive trades are at the mean / centre of the bracket.

Example: GBPUSD

For the week ahead, the Bracket Parameters are:

Upper Bracket Limit: 1.4605
Responsive Short: 1.4549

Responsive Trades Target: 1.4383

Responsive Long: 1.4216
Bracket Lower Limit: 1.4160

Note: Brackets appear to make sense at the 5-day, 10-day, 20-day levels. Whether these are computed on a calendar or rolling basis is open to debate, but I will be using calendar.

you realise we'd get burned as witches 300 years ago ?
 
S&P500 Daily Future (Wednesday)

Back to the live account, and the first S&P trade for a while.


"Mean Rotation" Trade

Sold @ 719.40
Bought @ 708.50

P/L = + 10.90
 

Attachments

  • ESWednesday.jpg
    ESWednesday.jpg
    88.6 KB · Views: 155
  • ticket.jpg
    ticket.jpg
    33.4 KB · Views: 160
Last edited:
That cable trade ended up being break-even over all.

Very silly, seeing as it was onside 200 pips on the first day.

However, the bracket did define the price action well during the early part of the week - what is required is closer attention to the trade management. Rather than stick the position on Sunday night and go away (always worth trying the lazy option first however :cheesy:), zoom in and manage on a lower timeframe.

This 15-minute chart shows how the stop could have been halved and the trade taken out at an ATR target on Monday.

I'm also leaning heavily towards breakouts with FX, so I think the next step is to drill heavily on Overnight Range breakouts for a while until the trade management part is second nature.
 

Attachments

  • review.gif
    review.gif
    12.2 KB · Views: 146
Cable Prep for Today

Firstly, the overnight range is defined, and a note of the 20-day ATR is taken:

Overnight High = 1.4277
Overnight Low = 1.4110

20-Day ATR = 0.0271.

Then, the 5-day range is examined for (lack of) trend. Visually, cable is bracketing nicely in the lead up to the Non-Farm Payroll numbers coming out of the States at 13:30pm, but also satisfies more formal analysis of a test for being in a bracket.

The 5-day bracket limits are:

Upper Limit: 1.4312
Lower Limit: 1.3985

Breakout targets are either in terms of the size of the range being broken out of, or ATR.
 

Attachments

  • rolling5dayrange.gif
    rolling5dayrange.gif
    10.8 KB · Views: 133
  • shortlongranges.gif
    shortlongranges.gif
    7.8 KB · Views: 147
Last edited:
Status
Not open for further replies.
Top