Jay's Journal

Trade Setup For 24th April

Here are my zones I'm watching for 24th April:

Resistance

1383.25-1383.75
1386.75-1387.25
1389-1389.75
1393-1393.50

Support

1378.25-1377.50
1373.50-1372.75
1371-1370.75
1366.75-1366

Something quite strange is that my zones didn't need to change much from yesterday. An odd occurrence as usually I have to at least change 4-5 areas. Recently the areas have had to change very little which indicates to me a decline in volatility and increase in stability.

My Outlook

We haven't really moved much beyond yesterday. I'm still holding my view of a slight bullish bias but I think it needs to happen this week. The more time that passes without continuing from this range, the more skeptical the market tends to become. The DJIA, NDX, SP and NYA haven't moved far from yesterday, just some further sideways consolidation.

Oil is still on it's run and I wouldn't even like to speculate when it could retrace. What is important to me is the divergence between it and gold. In fact I will be watching that divergence to give me a hint on where the market is likely to head next. If gold begins to take off higher I'm suspecting money will flow out of the equities and vice versa should Oil decline.

The VIX continues it's decline which is a good speculative sign for the equities. The pessimism in the broader market is declining. The VIX is also showing less excitement coming from the market in the form of reduced volatility. I am guessing this will expand next week with the Fed Interest rate announcement.

The USD is still producing its mixed bag. Declining against the EUR and AUD but increasing against the YEN. What is interesting about the USD/JPY is that Japan has had increasing inflation reports come out. You would expect Japan to increase their interest rates to combat this problem yet the USD still manages to increase against the YEN. Something to keep an eye on.

My Focus

Tomorrow I am going to work on my problem of reducing my profit target too early. If I feel the need to move my profit target down I am going to do so but then write in my journal the reasons why. I will see if there is a pattern to why I am lowering my targets. I am already adjusting them lower to begin with for the reduced volatility we have been seeing yet I am further reducing them unnecessarily.

Apart from that I will keep everything else the same. I will watch the 5 minute chart and switch to the 2 minute chart should things slow down. I am keeping a close eye on the Tick and the time interval for writing in the journal is going well for me. If anything I could possibly increase the time interval to 15 minutes apart at the minimum but for now I'll keep it the same. It did interfere with my trading last night but I can refrain from entries every ten minutes if I wish.

The Risk and Money management stay the same. So does the trade management but I am going to document it so I can see better what is occurring. The journal entries remain the same including writing in the journal when I put an order in and take it out without being taken. Sometimes so far it is benefiting me as my ideas of the market change.
 
Trading For 24th April

Here are my notes on the 24th April:

The major market announcement today is the New Home Sales at 10am so I'll keep cautious about trading near that time. The after market hours have been reasonably flat in regards to the closing price of yesterdays trade and where we are now. At 8.30am we had the durable goods numbers released that caused a decent rise from the market. Will see how it goes at the open.

9:35 The market opened with a 3 or so point gap higher with the Tick currently sitting around the zero line. After an initial push higher we have retraced quite strongly. It will be interesting to see if this sets the tone for the day or is just an opportunity for the longs to load up.

9:50 Market has been heavily moving down at this point and the Tick has shown that stocks support the move at this stage. We have just popped under the 1378.50 support area and are slowing down a bit. This move is pretty steep so whatever I do I will remain cautious.

10:00 Sheesh I was looking at entering a short position with the idea of the SMA acting as resistance but noticed the time was right near the new home sales data. I refrained as I didn't want to get taken out by a quick push. The news hit and the market plummeted about 5 points almost instantly. I'm guessing we aren't seeing favorable data. This sort of action is likely to keep me on the sidelines until we settle down a bit. in my simulation trading I commonly got chopped up by these types of moves after a Fed announcement. My belief is that I am best keeping some patience rather than chasing the glory of a large move. It seems the number was way down from what was predicted.

10:17 I entered a short trade at 1375.75 and the market was stalling up near my entry. I had a second look at the market and thought we are likely to have another push higher so I got out of the trade for a 1 tick loss. The idea was against the SMA on a downward stair step pattern. The market has now pushed higher so it was a good idea to get out. The Tick wasn't dropping below the zero so the move wasn't being welcomed by the stocks.

10:23 ok I was able to re-assess my original trade idea and saw the opportunity for a second entry. The market had its small push higher and then came down a bit. I got in at 1375.50 and I placed my profit target at 1374. We had a reasonably quick decline down to 1374 but the market moved back up to 1375 without my order being taken. I considered moving my profit target but decided instead to assess the current market. After looking at it I still saw the same strength in the move and left it there. The market came down a little bit after and took my target. I was happy with my trade management.

10:33 This market actually appears more volatile than it is. If you look at it in the context of the past few days it hasn't really made a major move, we are currently 5 points down on yesterday's close. It has been trading quite fast though so it needs improved timing or wider stops from me. We have yet to make strong new lows for the day. The Tick shows stocks not being as strong in the decline. We do currently have a divergence between the Tick lows and the ES lows which could spur a buy up. I know I'm not game enough to attempt a long trade in this market right now. I'd rather sit to the side lines and wait for something a bit more solid.

10:47 Things have currently slowed down on the selling side. That's not to say it cannot continue but right now things don't appear to be as gloomy. The Tick is steadily rising and we are testing the SMA on the 2 minute. There is a lot of momentum from the sellers weighing down this market right now so it will take a lot of strength to make a charge higher.

10:59 I find myself avoiding getting too focused on this market right now. I'm not exactly sure what it's intentions are right now as it has slowed right down. It is creeping higher as is the Tick. I get a feeling that this is a cat market right now. You know how a cat can come up to you purring and you pat it a bit and it gains your trust. The just as you are comfortable it starts swiping at you and hissing. I'm just not trusting of this higher move right now but I can't put my finger on why. I need to make sure I'm not just being blind to the long trades after the steep decline we have seen early on.

11:17 I'm still on the fence watching this market. There hasn't been much opportunity to enter a long trade. I am also going to lose the ego behind thinking this market's higher move is a front for gaining trust of the bullish sucker trade. The Tick right now is showing the stocks have gained positivity for the day and are making the grind higher. Right now we are at even for the day so it will be interesting to see what occurs.

11:30 Well I'd say a 10 point gain is pretty solid. The Tick divergence obviously was a good indicator of what was to come. That one is going into the memory bank to help with trade ideas in the future. Right now we seem to be on a mission to test the day's opening highs. We have had a small pullback as seen on the 2 minute chart but not something I was willing to trade. The Tick is still remaining optimistic. Not much to say really as there hasn't been as much as a hiccup since this higher move began.

11:42 I entered a short trade at 1383.50 after I hadn't been watching the market closely. It was a bit of a greed trade after I saw the big rejection we had near the market highs. I originally tried to scrap the order to get in but it took me before I got the chance to get out. I let it go on a short leash to see how the market went and it didn't look at all like it was going to come down. I managed to get out at 1384 for a half point loss. Great lesson in trading against the huge moves like this one. I was happy with my trade management as I didn't panic and I managed to get out without too much damage done. I'm going to call it a night.

Daily Wrap Up

I had a trading day of quite a few lessons. One in the form of trusting more so in what the Tick is telling me. Another is a lesson I have been taught many times before but occasionally I still try to push my limits. In a very strong trend it is best not to look for a turning point in the opposite direction.

I was pretty happy with the days trading although there was a lot of room for improvement. My trade management was a lot better today with every trade I entered worked as best as I possibly could. My two losing trades didn't have the greatest entries but they were both valid. My trade management allowed me to limit my losses when I saw the edge had changed. My profitable trade for the day was well timed on the entry and managed well.

The Tick was indicating we were set for a decent run higher with it's divergence of lows in comparison to the ES action but I wasn't too confident in trading it. The big move down was pretty strong and I wasn't too keen to trade against it. After that the trading opportunities were scarce. Instead of looking for a pullback to go long with, I attempted trading a rejection. It was a valid trade idea but in the context we had reached that point, I probably would have been best sitting on the sidelines.

For following my focus I give myself a 'B'. I improved with my trade management by assessing my profit targets when I get the urge to move them. I was considering moving up my profit target on the second trade but after looking at the market, the edge still indicated to me we would likely reach it. Unfortunately I didn't document my reasons for closing out my losing trades early and is the reason for a 'B'.

Otherwise my risk and money management are doing well and I don't seem to be having much issue with them so far which is good. My focus was good until we saw the extended upward trending move and then I attempted a trade after not closely following the market. The 5 minute and 2 minute charts were well monitored and I was switching between the two when necessary. I kept a close eye on the Tick and even managed to find another element to add to my arsenal.

Trade 1: 0.25 Loss
Trade 2: 1.5 Win
Trade 3: 0.50 Loss

Daily Result: 0.75 Gain
 

Attachments

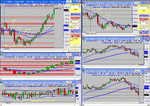
  • 24-04-08.gif
    24-04-08.gif
    76.1 KB · Views: 168
Last edited:
Trade Setup For April 25th

Here are the zones I have recorded for the 25th April:

Resistance

1393-1393.50
1399.25-1400.50

Support

1385.50-1385
1377.50-1377
1372.75-1372
1366.75-1366

No Trading For 25th April

I am having a day away from trading. I am feeling pretty exhausted from my trading recently so I am going to have a three day break and avoid any market contact. I don't want to burn out and have made a lot of positive progress over the past few months. I want to keep my trading fun and make sure I allow myself to take days off when I want them. I'll be back refreshed and ready to go on Monday.
 
Jay,

Your journal is a great example of what good looks like and I admire your work rate and dedication both to the journal and to your trading but I must ask, dont you feel your putting in a lot of work/screen time for very little gain.

I always felt that the purpose of active trading is to make a larger profit then a buy and hold investor would make out of the same instrument, for me the shorter the time frame and therfore the greater the time spent in front of the screen can only be justified with a larger return.

I'm not criticising your trading just asking a question, maybe your returns would be better if you were using daily bars and hourly rather then 5 min and 2 min. It might even help you stick to your plan better as you wont have to concetrate for such long periods. Both fattigue and boredem can ruin a trading plan.

Just my thoughts, I hope you find them constructive:)

If I'm correct, jay isn't sitting in front of his screen all day during market hours, but only 3-4 hours. Even if he only averages 1 or 2 points per day on the ES, after time, and played with decent size, his account will grow nicely. The advantage of intraday trading is that he can place his stops very close. If you're trading off hourly and daily bars you need to be aware of the overnight action too... which kind of has it's own problems. Just my 2c.
 
Hey Elefteros,

Thank you very much for bringing this up as it has been something I have been meaning to discuss in regards to risk/reward management etc. Thank you very much for your kind compliments on the quality of my journal, it does make me feel good when I get such comments.

Ok now down to business. You're right about putting a lot of screen time in, I trade from the market open at 9.30am to usually about 11.30am-12.00pm. So I generally get about 2-2.5 hours in. Although I believe that is a fair bit of screen time, full time traders who trade an intra day time frame would probably say it's peanuts compared to their 6.5 hours.

The purpose for trading intra day for me isn't necessarily that I want to make more, though it can do so. For me the purpose of intra day is because it suits me better. I personally am better and finding moments when the market changes which I can only do when I see trade for trade.

A major benefit I find to trading my time frame is that I can control my risk much better and minimize it immensely. The longer the time frame one trades generally increases the amount one must risk to make a return. This works on two levels.

One is that the peaks and troughs of the market tend to be bigger, I tend to refer to them as waves. On a daily time frame the bottom of a wave when you get an entry could be say 10 points away yet the bottom of a wave when you get an entry on the 5 minute chart could be 4 points. I tend to place my stops behind the bottoms or tops of waves as an added bit of security, unless I get on quite early and I place them behind support and resistance areas or EMA's that have become guides for a trend.

The second level this works on is time risk. Not many people discuss this but it is something quite a few traders factor in. If I have entered a trade, I want to see the market move in my direction reasonably quickly. For me it's no more than a few minutes before I pull a trade if it hasn't taken me into decent profit.

I personally believe that if I enter a trade and it hasn't gone anywhere for say ten minutes, the original reason I got in for the trade may not necessarily still be there. In a daily time frame there is the added risk of overnight fluctuations. Some traders are quite good at picking where the market is likely to go at the open the next day, I personally am not one of those. I don't like overnight risk because I am talented at picking changes in direction, not predicting direction.

Now to get on to the main risk reward area. Right now I am seeing a couple points per week profit. It's not much, but the return depends on ones capital. I actually have a two lot system I use but before I get to that I will explain something first. If I was only to make the 2 or so points per week like I am now, I could be making a lot money wise by managing risk.

My statistics have my losses quite minimal. I'm not going to check my exact stats right now but for memory my losses are generally 1-5 ticks. My wins are generally 2-7 ticks but my win % is roughly about 65%. So with those stats I could confidently play around with my risk amounts per trade. Instead of my current less than 1% risk, I could comfortably risk say 5% per trade, that would still be reasonably conservative according to my number of trades per week and my other stats. By risking more I'm saying to increase the amount of contracts obtained for each trade, not increasing the amount of points I'm risking.

Using a quote from a mentor, "It is easier to make 1 point with ten contracts than it is to make 10 points with 1 contract". It is much easier for someone to adjust their own risk than it is to try and get extra points out of it. It is extremely important to know your own statistics of trading before you can safely adjust your risk amounts though.

Now back to my two lot trading system. I personally am quite a defensive trader. With my two lot system, my first lot of contracts are usually a scalp. That is what you are currently seeing with my trading. I am making sure my first lot is remaining consistent. The second lot when it comes in, is used as a trail on moves. So I would scalp the first lot at say a 1.5 point profit target and then the second lot is left to run. I move up the stop loss after the first target is taken so no matter what I get out with a small gain or break even. If the market keeps going I continue to trail the stop as the market moves in my direction. With my simulation trading, about 3 out of 10 trades would gain more than 3 points with the trailing. The rest tended to result in a small gain.

Right now I am pretty happy with how the one lot is progressing. It isn't making large point gains per week but it is consistently profitable at this stage. With more time under my belt, the trades will get better and hopefully the one lot will obtain 1-2 points per day as Firewalker says. However when the two lot comes in, the points will increase again by quite a bit.

I am very grateful people like yourself offer constructive criticism and for that I thank you Elefteros. It is hard sometimes dealing with the fatigue because I begin my trading at 11.30pm due to living in Australia. However I find myself most nights doing well and occasionally not lasting the full couple of hours. The same can be said for the boredom when we see a market that continues in the same direction for an extended period of time without much of a pullback. I often find myself doing other constructive things during that time until the market gets more interesting.

Thanks again Elefteros, the fact that you have offered your advice and thoughts about my trading shows a willingness to help which I appreciate greatly.
 
Hi Jason,

I am new on here and want to thank you for posting up...It's fascinating and interesting.

Kind Regards
Wanderer
 
Jason,

' I could comfortably risk say 5% per trade, that would still be reasonably conservative according to my number of trades per week and my other stats. By risking more I'm saying to increase the amount of contracts obtained for each trade, not increasing the amount of points I'm risking.'

This is correct and is what i will be doing aggressively myself however with such tight (stops 1-5 pts) and such small profits (2-7 pts) your profitability will erode as you increase contract size as you will not be able to get in and out as quickly at your desired price points.

What is your target no of contracts that you want/need to be trading in order to achieve your financial goals and will this system still be viable trading that many contracts?
 
Wanderer thank you for your kind post. It is good to hear people when they say they enjoy the journal or get something out of it.

Elefteros, I know exactly where you are coming from with concern to contract size and ease of getting filled. I was trading CFD's on equities a year ago on some stocks that were very light in volume. A few times I found myself holding much more in size than I could comfortably let go on the market should my stop be hit. I learnt that lesson the hard way.

I have deliberately chosen the ES (S&P E-Mini) futures because of the size of volume that goes through each day. Orders of a few hundred contracts are swallowed up pretty quickly on the ES at times. Usually the bid and ask columns are filled with 500+ contract orders and occasionally the 1000+ serious traders who are legit.

I don't exactly see myself trading 100+ contracts at a time, though I wouldn't avoid doing so should I get to that point. Considering 1 point on the ES is $50 for one contract, trading 100 contracts would equate to $5,000 per point. I'm pretty far from that point right now.

I can't see the profitability eroding any time soon as the professional traders in the ES are constantly trading in and out with 100+ contracts at a time. It is one of those markets that are highly used by scalpers due to the liquidity.

I personally don't make financial goals with my trading. It may be a mistake on my behalf but it's one of the ways I remove the money trades from my trading. I'd like to be seeing consistent results that can be converted into paying the bills and then some extra for saving and lifestyle. I have been in trades before thinking, if this market reaches X it will mean I have made $X dollars. Those are the trades that bring hyper emotions to the game and distort the rationale in trades.

The way I see my progress so far is that I have come a long way in a short time. When I first began I was losing a lot. Then I went to losing a bit which then went to breaking even.

From Mid February this year I have seen 7 profitable weeks and 3 losing weeks. Though as I stand right now I am at roughly break even with my starting capital for my Futures trading. This is quite an achievement considering I dropped roughly 10% of my account value in 2 days. Since that point though I have reduced my size of contracts and worked away. In fact from the Mid February lows, in 10 weeks I have increased my capital by 14% using less than 1% risk per trade. As people have seen, I don't place that many trades.

I guess what I am saying is that trading isn't going to provide overnight results for me. It takes hard work and a lot of effort. The work isn't necessarily the time put in but the striving for consistency. I used to trade a mechanical system that worked for one or two big wins a year but the rest of the time was in the red. I now place much greater importance on consistent small gains and smaller losses but still with the big hitters when they present themselves.

In four months of live trading I don't expect to be making massive point gains per week nor do I really find it necessary to make a comfortable living. Of course it would be nice, but in time I will be able to build up and evolve. Taking it one step at a time was hard at first, but coming from 2 years of losing gives me the motivation to keep going.

Again Elefteros thank you for your questions and constructive criticism. It is good to have people question our systems because it gives us a chance to reflect on what we are doing and why. Hopefully it also provides others for things to think about in regards to their own trading.
 
Trade Setup For 28th April

Here is the areas I'm watching for 28th April:

Resistance

1399.25-1400.50

Support

1396.25-1395.50
1390.25-1389.50
1384.75-1384.25
1380.5

I only have 1 resistance area because we haven't really traded up here at these levels with this contract. There is data for it that I can't access as it's too far back but in January this contract wasn't the main contract for the ES.

My Outlook

Well this is a very interesting point we are at and such well timed. We are riding the top of the previous range highs as we get closer to the Fed meeting on Wednesday. I am thinking this week will become a make or break week for getting higher out of this range.

Right now the DJIA and NDX are trading above the previous range yet the SP is still at the top of it. It has tested the highs at 1400 but yet to make a move out. The current pattern on the charts is looking favorable for making the usual test of range highs before continuing back up higher. However it could just as easily turn into a false break and move back into the range should we get unfavorable news from the Fed.

The VIX is still pursuing its decline in volatility and in put option activity. This is promising leading into the Fed meeting which indicates to me the broader market is expecting good things. Gold's decline has continued and is close to the April lows. Oil is still on its higher advance which widens the divergence between Gold and Oil. I am keeping my eye out for the resulting move from both of these commodities in relation to the Fed announcement. I am suspecting we may see the divergence begin to close after Wednesday.

The EUR/USD has come off its highs yet it's too early to signal a strengthening of the USD. It has been staggering up at the highs for quite a while but hasn't really made strong indications of its direction just yet to me. I feel like a record player but I think the Fed announcement will set the scene for the USD strength this week.

After all this my bias is set to remain neutral, not necessarily because the indicators say so but because of the Fed announcement this week. I haven't seen things look this dependent on the news announcement before. It appears as though everything is waiting for guidance right now and placing a lot of weight on it. According to the indicators, things look promising for a rise but I wouldn't be willing to place any overnight trades if I was a longer term trader.

My Focus

Right now my trading is working well for me so I want to keep my focus working on consistency. In light of how my trading has been progressing I will start thinking about when to implement my two lot system again. I am currently at break even with my account so I want to create a bit of a buffer before I bring it in. The reason I want a buffer is because it is a bit experimental with my own capital being risked.

Last time I was trading my two lot system with my own capital I panicked because it was the first time in the Futures market with my own capital. I'm not acting as though I will be trading with free money, I'm more so trying to remove the hyper emotions related with increasing the capital at risk. It's not a big capital risk but is more than I am currently risking. I have become used to my small trades so it needs to be carefully modified.

So that being said, the focus for right now is staying the same. Focus on the 5 minute and 2 minute charts as well as the Tick. I suspect we will have a quiet few days and on Thursday we will see the volatility expand quite a bit. So I may need to put some focus on the 2 minute chart. I will continue to record trade orders I put in and remove so I can see the underlying patterns.

My journal will keep the same time period intervals for entries. I will leave the risk, money and trade management the same. I will continue to mention my reasons for closing out a trade if it doesn't hit my profit target and see if there are any patterns for that as well. Apart from all this, I will continue to have fun and enjoy watching the markets.
 
I just wanted to clarify something I mentioned in the Risk to Reward post I made. When I mentioned that risking 5% per trade would be quite conservative according to my statistics I am hoping developing traders new to the idea of money and risk management don't take that as a comfortable amount to risk.

Now the reason the 5% according to my stats would be still conservative is due to the fact that a 5% loss would be hit when my hard stop gets hit. Usually my hard stop is 2 points away but I find my edge is lost prior to that being hit in most instances. Most of my trades that are losses are usually half a point. Half a point of my total 2 point risk is one quarter. So when I'd have my 5% hard stop, most of the time I would lose a quarter of that.

That being said, my comments on it being conservative is probably something I should have worded better. I personally would not have a 5% risk on my hard stop because it doesn't fit my risk tolerance levels. Should a trade go straight to my stop and I lose 5% in one trade, it would definitely not sit well with me. I do not recommend people risk 5% unless they have a great win loss record to make sure it doesn't dent the account when it occurs. I'm not talking about a record during simulation trading either, I'm talking about a live trading record.

The reason being that 20 losses in a row, should you not scale down your risk after each loss (that can be hard with trading futures for example), you would be wiped of your account. Some may say 20 in a row is not likely but should the market gap your stop order as people remove their orders and you can lose more than that in a trade. Not to mention that each time you lose, you have to win more to get it back in % terms and also due to brokerage costs.

Hopefully people new to the idea of money and risk management understand that my comments about risking 5% were for demonstration purposes of increasing risk to increase reward instead of trying to gain bigger moves out of the market. It can be a dangerous practice if you are not aware of your statistics for winning and losing and increase your risk by too much. For me personally, 3% is probably as high as I would go and even still most of my trades would be closed out for 1.5% and less.
 
Trading For 28th April

Here is my journal for the 28th Journal:

Today there is no major news for the US market being released. I think we will only have a few company earnings reports to sway the market. Otherwise it will be left to itself and speculation by investors in regards to the Fed meeting coming up. The weekend market has seen a small rise but nothing to extraordinary. Currently we are seeing it declining down the SMA on the 2 minute chart from about 7am. Will see if this carries through into the market open.

9:34 We have had a slightly higher open and paused near the 1400 Resistance area. The Tick has shown stocks opening pretty neutral early on. Things are not to decisive early on so some time will be needed to get the feel of the market. This 1400 area has been a lid for quite some time so will be pretty difficult to break through.

9:45 Market has moved down to the 1396 support area and slowed down quite a bit. The Tick is showing the stocks have opened pretty mixed without clear direction. The move down has been pretty steady right now and I'd like to see the strength of a bounce before getting in any trades right now.

10:00 We just had a small rise that was pretty feeble. I was considering shorting at 1398.50 but was concerned about the 1396 support area and the EMA we have bounced from. Seems like it may have been a good trade. The Tick has been resting above the zero line so things are a bit mixed right now.

10:15 The market had a quick jump higher after making a 1-2-3 bottom pattern at the 1396 support area. We are currently at a possible double top area so the question is, are the buyers or sellers stronger right now? The Tick indicates the stocks are keen to be bought at the ask price. The lack of enthusiasm to sell has been shown by the stocks with their refusal to move largely below the zero line on the Tick.

10:27 I feel myself tempted to get on a long trade right now for a push to higher prices but for some reason it doesn't sit well with me. I'm just not sure we can break the recent highs we have been having. For that reason I am going to stick to the sidelines for the moment and wait for more to develop. The Tick is still showing the rejection of a sell off but I just can't jump on board the long train right now. I feel emotions of "it's a sure thing" which usually tells me it's a good time to sit out. I could very well be wrong and miss a great trading opportunity though missing one opportunity isn't the end of the world.

10:45 Ok so it seems placing the long trade would have been a good trade. The market reached 1402.75 before stalling. Right now we have had our second decent attempt to go lower on the Tick.

10:49 I got in a long trade at 1401.25 for an upward stair step pattern and bounce off the SMA on the 2 minute but the market looked iffy right away. The Tick has been showing more appeal to the downside right now even though it may not indicate a turn around. Trade was exited at 1400.75 for a half point loss, not a great entry on that one.

10:57 Missed an entry at 1400.75 for a long trade. Market traded at that price but got away before taking me with it. A touch early on my previous trade it would seem. The Tick has rebounded back into the positive again which is a good sign for the uptrend.

11:00 There is an interesting pattern I keep seeing and was trading during my simulation period but am yet to trade it with my capital. It is when we see a candle commonly seen at the top of a market which has a long tail. However instead of being at the top or bottom it presents itself mid trend. Whenever I see this I think now would be a great time for a trade because instead of reversing trend it usually provides a good opportunity to get on board the direction of the trend. For some reason I find myself not willing to trade it.

11:12 We are seeing some slow down in the uptrend and a bit of a possible reversal of trend. The Tick has shown more acceptance by the stocks to sell and we have hit the SMA and declined on the 2 minute. I am indecisive with my trading at the moment as my ideas are mixed for the market. Some things tell me the market will go down, others tell me we will see a rise. Not a great mindset for my trading so I will take it easy. I'm finding it a tough market to trade right now.

11:34 Got in for a short trade against the SMA on the 2 minute and possibly a rejection off the zero line on the Tick. Market sat there doing very little and the Tick began to gain some strength. Sticking to my time stop I decided to get out for break even. Looks like it may have been a bad idea though as we have just moved a bit lower. Tonight just seems to be one of those days where I'm not at the top of my game. I'm spending too much time focusing on myself and not enough focusing on the market. I think I'll leave the rest of the day alone in regards to trades and just watch the market action.

11:49 Time to call it a night. I made a couple of attempts which I am happy with but things just weren't lining up for me. I was getting mixed signals with my trades and having a hard time deciphering what was more important from the market. Too much emphasis was on my own personal thoughts as opposed to what the market was telling me. Something to keep in mind for tomorrows trading.

Daily Wrap Up

Sometimes I have days where I am out of touch with the market, usually I don't trade them but today I did. I am actually happy I did trade it because I was testing the market instead of just assuming I was out of touch. It gave me a good opportunity to work on my trade management which I think was done pretty well. The two trades I got on were seen to be pretty ordinary entries but I managed to mange them pretty well and get out with minimal loss.

My first trade was right in the middle of a wave instead of at the top or bottom where I ordinarily manage to get on. My second trade was an attempt to short what turned into a long uptrend. I found myself seeing a possible trade idea but then a few different things would contradict that. Instead of how I can usually filter the more important from the less important signals, I was having difficulty doing that today.

I'm not going to sit here and complain about my performance on entries because that doesn't solve anything. Instead I will use tomorrow as a 'get my focus back' type of day. I will take it easy on the trades and pay more attention to the market action. I was happy with the trades even though they weren't great, they had valid ideas behind them but I just was ignorant of the context. Something I can work on.

Trade 1: 0.50 Loss
Trade 2: Breakeven

Daily Result: 0.50 Loss
 

Attachments

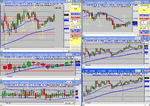
  • 28-04-08.gif
    28-04-08.gif
    76.4 KB · Views: 162
Trade Setup For April 29th

Here is the zones I'm watching for 29th April:

Resistance

1400.25-1400.50
1403.50-1404

Support

1396.25-1395.50
1390.25-1389.50
1384.75-1384.25
1380.5

Market Outlook

We had some consolidation in the market with todays trading which I believe will carry in to tomorrow. I don't suspect any major moves will be made prior to Wednesdays Fed meeting. If I watched the Treasury and Bond markets I could probably see a better idea of what the market is expecting but it's one area I don't pay close attention to just yet.

All the Indexes are waiting it would seem. The NYA has popped above the 50 EMA on the weekly chart but only marginally. I'm not holding any strong thoughts on the market until Wednesday is done and dusted. VIX is still continuing its same path it has been for the past month so nothing really new is coming from that.

Gold and Oil are also sitting patiently waiting for guidance and haven't made any major moves. It truly does fascinate me that many markets appear to be hanging on the decision from the Fed. It is placing a big emphasis on it that is for sure. The USD is settling at the moment as well which again signals waiting before Wednesday.

I'm not holding any bias right now and am keeping in mind that tomorrow could very well be similar to today in it's low volatility and back and forth action. I think it will be a difficult week to trade because right now there seems to be very little direction coming from the market. It appears as though we are waiting for the Fed to give us direction.

My Focus

After todays performance I am going to place more emphasis on watching the charts tomorrow. I'm going to tone down my trading a bit and give the first hour or so time to present to me what it is doing. The day may turn into a watching day and with the news coming up on Wednesday it may not be such a bad idea. I won't rule out trading just yet because I could find myself reading the market well. I just want to make sure that I pay more attention to the market than entries and exits.

The rest of my focus remains the same with risk, reward and trade management. My trade management has been going well so I want to keep that consistency going. My journal is working well for me also so it will stay the same. Right now I am just working towards consistency and being open to the market.
 
You might be interested in this, it gives a greater picture to see why price found resistance around 1404-1405.

Hey Firewalker,

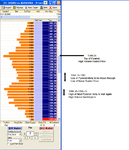
Thanks for directing my attention to the post about resistance at 1404-1405. I am intrigued as to why you mention no volume as being a resistance area. I'm not great with volume analysis however the histogram to the right shows little volume at 1405.

The way I interpret different price volume is that the market tends to find support and resistance at the heavy traded areas. My personal reasoning is that people have opened positions there and the natural tendency is for people to close out their positions as close to break even as possible if things don't go their way or if the market has risen and come back. I often find low traded prices are blown through to get to the heavily traded areas.

I'm not great when it comes to volume, can you please explain the chart a bit? My support and resistance areas are placed according to last traded prices, considering the June contract wasn't the main contract in January, I tend not to place much emphasis on the resistance above the recent range until we start trading there. If that makes sense.
 
Jay,
i have only just stumbled upon your journal after fw99 prompted me to cast my reading net a bit wider now that i'm an advisor.
I wish I'd found it earlier, it truly is an excellent production. Your logic, clarity of thought, self-evelauation etc are all a huge credit to you. I only wish somehow that all new traders could be forced to read it before attempting to launch themsleves on their own adventures in the markets. I think you would save a lot of people a lot of pain. (Assuming they were bright enough to pay heed to the lessons you're learning and passing on)

Thanks for providing the highlight of my week, i shall certainly be stopping by to check out your journal on a much more regular basis.

Garry
 
Hey Firewalker,
Thanks for directing my attention to the post about resistance at 1404-1405. I am intrigued as to why you mention no volume as being a resistance area. I'm not great with volume analysis however the histogram to the right shows little volume at 1405.

I'm sorry if my chart confused you. Please stick to your own methods and don't let me or anybody else influence you. You're doing fine.

The way I interpret different price volume is that the market tends to find support and resistance at the heavy traded areas. My personal reasoning is that people have opened positions there and the natural tendency is for people to close out their positions as close to break even as possible if things don't go their way or if the market has risen and come back. I often find low traded prices are blown through to get to the heavily traded areas.

Absolutely correct.

I'm not great when it comes to volume, can you please explain the chart a bit? My support and resistance areas are placed according to last traded prices, considering the June contract wasn't the main contract in January, I tend not to place much emphasis on the resistance above the recent range until we start trading there. If that makes sense.

You had resistance about where I had it, so does 1 point difference matter? I don't think so... Anyway, the edges of those heavy traded ranges with high sideways volume often have very low volume. So, let's just say I think I take a similar approach, but I often consider low traded areas to be of NO resistance or NO support. Price can just fly through them. Which often happens when airpockets are created. But the edge of the low volume range is usually the outer border of an important zone of S/R, in this case resistance.

Notice how today, on the Fed news, 1405 proved again to be the level to break. On a 5-minute chart the two candles closed right there. Selling pressure is obviously to be found there and it's a mighty resistance level.
 

Attachments

  • es_1405.jpg
    es_1405.jpg
    16.5 KB · Views: 129
Garry,

Thank you very much for your kind and very supportive post. It is very touching to have someone compliment the work we do in what is usually an individual pursuit. Having people visit my thread and give a little nudge of support does wonders for me in what can sometimes seem a lonely journey. You may not realize the great impact your words had on me but I assure you they mean a lot.

I honestly don't have the answers to become an expert trader but if other traders come here and learn from my mistakes or lessons I have previously learnt then I am extremely happy.

Firewalker,

I'm sorry if my chart confused you. Please stick to your own methods and don't let me or anybody else influence you. You're doing fine.

I welcome everyones opinions and advice on markets. Anything anyone offers can either help me clarify further why I do what I do or open my eyes to something I overlooked or haven't yet looked at. I don't like the idea of staying set in my own ways without the possibility of learning something new or growing. I don't believe the markets stay the same so I shouldn't expect to either.

You had resistance about where I had it, so does 1 point difference matter? I don't think so... Anyway, the edges of those heavy traded ranges with high sideways volume often have very low volume. So, let's just say I think I take a similar approach, but I often consider low traded areas to be of NO resistance or NO support. Price can just fly through them. Which often happens when airpockets are created. But the edge of the low volume range is usually the outer border of an important zone of S/R, in this case resistance.

I think I see what you are saying with this now. With the ranges the tops and bottoms usually aren't heavily traded because they hit the area and rebound pretty quickly, hence not many traders get positions there. However in between the action is back and forth and the volume for those traded prices is quite high. As the market leaves the range, it doesn't take much to get through it because there isn't high volume open orders to prevent it doing so. The air pocket you speak of.

The volume on the price histogram often looks like pyramids with the low points being the pockets. Usually the market moves through these areas and finds resistance or support toward the top of the pyramid. Hence the top or bottom of a range is usually at the low of those pyramids because not many contracts have swapped hands.

Please let me know if this is the idea you are talking about or if I am way off.I have put an image below to help show my understanding. I really appreciate your input to my journal FW. I haven't yet looked very long at yesterdays trading because I was out injured but I'll look at it soon to see your example at 1405. Thanks again mate.
 

Attachments

  • Volume-Example.gif
    Volume-Example.gif
    30.4 KB · Views: 184
Missed Wednesday's Trading

Unfortunately I tore a coupe of ligaments in my ankle playing basketball before I got a chance to post my Tuesday 29th April trading journal. I managed to get my Support and Resistance zones down for Wednesday 30th April but didn't get a chance to trade because I was getting seen by the Doc and getting Xrays. Probably not the best idea to trade when I am out of it with pain relief.

Ok so here is the journal for Tuesday 29th April:

I suspect we are going to see similar market action to yesterday ahead of Wednesdays Fed Meeting. The Consumer Confidence report at 10am could give the market a bit of direction however I'm not convinced it will have as much impact as it normally would. The after market hours action we have seen has been pretty flat with a small gap down likely at the open.

9:37 Market has opened with a couple point gap down which has now been filled. The Tick is resting above the zero line indicating optimism from the stocks early on. Will be interesting to see the strength of this upward move, right now it looks pretty good.

9:50 This is an interesting market we are seeing here. After the push higher we had a strong selling period which lasted about 5 minutes. Now we have stabilized at slightly lower lows for the day and seem to be fighting the lower prices. Pretty decent swings without really going anywhere. The Tick is showing the stocks are a bit bearish after being open. The Tick action is mainly below the zero line though not with much gusto.

10:03
After some initial bullish excitement from the market after the Consumer Confidence report we have a decent move of the same size in the opposite direction. I'm guessing it's best to sit on the sidelines whilst this thing works itself out. The Tick has shown a move that usually dictates the direction of the market in the short term. It's a candle that opens at an extreme and moves down to the opposing extreme. From the looks of this the market may take a downward direction for a period of time. However the fact that it didn't stay at the extreme does have me questioning it.

10:19
Market has moved lower but the Tick is rejecting the idea of constant selling. For some reason the way we are sitting below the zero line is not appearing like a strong selling market. Instead it looks pretty flimsy but that could change on a dime. For the moment I'll just bide my time and wait for something solid.

10:37
Well the market has kept moving lower without much thought of a bounce and no real opportunities to get in. We do have a slow down of the lower move now which is showing some rejection on the Tick of going above the zero line. Will need to see how this latest move pans out. I find myself wanting to short the resistance the SMA is providing but think we need a bigger move higher from the look of teh 5 minute chart.

10:49
We did see a bit of a move higher but not what I was waiting for. I was tempted to trade against the SMA at 1390.25 but held back. I think I am best leaving today as a watching day and simply enjoy the back and forth between buyers and sellers. Well maybe just the sellers having fun in the market. It appears the support areas are not giving the buyers much optimism.

11:08
After the small move higher we had another decline but this time it was smaller than the last and lacking the strength it has had. I'm not sure if we will see a turn around of the trend but I do believe we will see a decent bounce at least. The Tick is showing signs of exhaustion on the selling side. Maybe the stocks need a breather before continuing or possibly had enough?

11:28 I took a short trade at 1390.25 against the EMA on the 5 minute chart and a Tick divergence. The market hung around at 1390.25 before moving higher at which point my edge had gone. I got out at 1390.75 for a half point loss. It seems as though we might have a slow grind higher right now.

11:32
I'm going to call it a night. It has been a long slow grind down and now it looks like it will be a long slow grind back up. Not great for my style of trading and these are the times when I'm best leaving the market alone. I took one trade which was a good entry with good trade management but just wasn't meant to be. I didn't place enough emphasis on the fact that the Tick showed the stocks gaining strength so it was something I could have done better. Not to worry, a good day of trading but just not a profitable result.

Daily Wrap Up


Another tough day of trading for me but I was happy with the way I traded even though it was a loss for the day. Early on I was taking it very easy and just seeing how the market panned out and at one stage was opting to leave it as a watching day. We had a bounce later on that I thought may turn into the market rolling over for a further decline but it wasn't meant to be as the Tick showed stocks were gaining strength. It was a good trade idea and it did have a minor pullback about 15 minutes later however it was just a small move in the face of a bigger uptrending one.

In regards to following my focus I am giving myself an 'A'. I took it easy and kept my focus on the charts. I knew the Tick was gaining strength and opted for a potential trade against that strength which was a loss. However my management of that trade was good, the entry idea was good but I just managed to be a bit early. My risk and money management was good. I'll just have to look to Thursday and hopefully the market opens up a bit after the Fed meeting results.

Trade 1: 0.50 Loss

Daily Result: 0.50 Loss

Here were the zones I had for Wednesday 30th April"

Resistance

1394-1394.50
1397.50-1398.25
1400.25-1400.50
1403.50-1404

Support

1390.75-1390
1387.50-1387
1384.75-1384.25
1380.5
 

Attachments

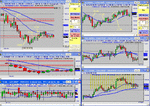
  • 29-04-08.gif
    29-04-08.gif
    76.3 KB · Views: 144
Trade Setup For May 1st

Here are the zones I'm looking at for May 1st:

Resistance

1390-1390.5
1394.50-1395.25
1399.1399.75
1403.50-1404
1407

Support

1384.25-1383.75
1380.5
1377.50-1377
1372.75-1372

My Outlook

Well what an interesting reaction we had to the 0.25% Interest cut. From the looks of it things are slowing down in regards to the whole Subprime issue. What is interesting is the stocks who have taken the grunt of this debacle, the financial stocks and some other non financial companies that were investing in poor shaped bonds. These stocks have been the ones pulling the market down whilst we are still seeing some good earnings results from stocks not related to the issue.

Now theoretically, the big problem has been a loss of credit in the market. Less available funds for borrowing and lots of investor funds taken by these bad bonds. So with the Fed lowering borrowing rates and everything else we have seen them doing, we are seeing credit returning to the market. Slowly but surely. Now if the stocks who weren't affected by the credit issue are doing well, with an injection of funds like the Fed is providing we should see the financial stocks start to regain their strength. So instead of the strain between the strong not affected stocks and the weak affected stocks, I'm guessing we could see the strength get back into the market.

This is a longer term view and one that I don't old much weight on but just the way I tend to see things appearing. So with that, more shorter term we are seeing the DJIA, SP and NDX all struggling at their current levels. Though they are all still in their uptrending pattern and are yet to make a lower trough since the March lows.

That being the case I think we would need to see a strong push from the market before the end of the week otherwise we could be in for another decent sized decline. I was surprised at the market action after the Fed Announcement. I though the volatility would expand further than we saw which does indicate to me that the market is settling down a bit more. The next few days should hopefully tip the hand of the market sentiment.

Now something else that is of importance is the reaction from Gold and Oil after the announcement. I imagined Gold would go higher after the rate cut being that the USD should lose more ground. Instead we saw a reduction which may indicate more funds are going to the investment in US stocks for growth as companies are going to have more access to funds to expand. Especially the companies that had relatively no exposure to the credit problems.

Oil was an interesting one also. Oil has now declined even though we have seen what is likely to result in a reduction of the USD worth. Lower USD value is likely to keep OPEC from increasing supplies if they had any thoughts of doing so.

The VIX didn't show an abnormal expansion in volatility after the meeting results yesterday. That is another sign of stability coming into the market. It is still on its decline it began from the March lows which is a good sign for the bulls.

Now onto the all important USD. After rate cuts we have recently seen the USD dropped like a brick but what is odd is that it pretty much did nothing. The rate cut hardly caused a murmur. Is this because the market expected it or that there are more benefits to the low borrowing costs of the USD? Either way, the lack of impact from the rate cuts also suggests we may not be reacting to the market news like we have been in the past 9 months or so. As a result I think if we see a decline from here it may not be as wild as we have previously seen.

So I am keeping a neutral bias at the moment. At least for the next few days so we get some time to work out what the rate cut means for the economy. Once we take a decisive move it could give some more guidance but for right now the game is still in anyones hands in my mind.

My Focus

My focus tomorrow is again on the charts and watching them instead of looking for trades. I feel I have been putting too much into trades and not enough towards market analysis. So the journal entries need to be maintained at the same interval and I'll switch to the 2 minute chart should we see a slow down in the market action.

I'm still noting down any times when I place an order and remove it from the market, though I haven't done it this week which is a good sign. My money, risk and trade management remain the same as they are working well for me. As well as all this, I'm looking to have fun.
 
Top