Indicators are liars! Support and Resistance Trading for the S&P emini

Hi everyone

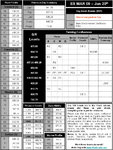
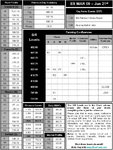
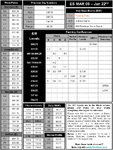
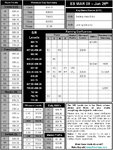
Please find attached todays levels. The S/R numbers are in the black column, the MP, Pivots, Fibs, Simple Moving Averages and Summary Numbers are for confluence and information.

Always remember to use the numbers as a guideline for potential areas of high probability plays.

Always use a set up based upon your system to enter a trade
.
Good trading all
 

Attachments

  • supportandresistance 08-01.jpg
    supportandresistance 08-01.jpg
    187.2 KB · Views: 175
Hi everyone

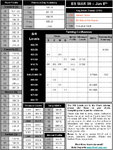
Please find attached todays levels. The S/R numbers are in the black column, the MP, Pivots, Fibs, Simple Moving Averages and Summary Numbers are for confluence and information.

Always remember to use the numbers as a guideline for potential areas of high probability plays.

Always use a set up based upon your system to enter a trade
.
Good trading all
 

Attachments

  • supportandresistance 09-01.jpg
    supportandresistance 09-01.jpg
    187.7 KB · Views: 165
Hi everyone

Please find attached todays levels. The S/R numbers are in the black column, the MP, Pivots, Fibs, Simple Moving Averages and Summary Numbers are for confluence and information.

Always remember to use the numbers as a guideline for potential areas of high probability plays.

Always use a set up based upon your system to enter a trade
 

Attachments

  • supportandresistance 12-01.jpg
    supportandresistance 12-01.jpg
    183.1 KB · Views: 156
Hi everyone

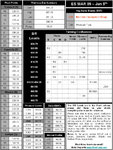
Please find attached todays levels. The S/R numbers are in the black column, the MP, Pivots, Fibs, Simple Moving Averages and Summary Numbers are for confluence and information.

Always remember to use the numbers as a guideline for potential areas of high probability plays.

Always use a set up based upon your system to enter a trade
.
Good trading all
 

Attachments

  • supportandresistance 13-01.jpg
    supportandresistance 13-01.jpg
    187 KB · Views: 163
Hi everyone

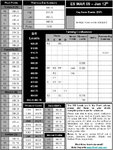
Please find attached todays levels. The S/R numbers are in the black column, the MP, Pivots, Fibs, Simple Moving Averages and Summary Numbers are for confluence and information.

Always remember to use the numbers as a guideline for potential areas of high probability plays.

Always use a set up based upon your system to enter a trade
.
Good trading all
 

Attachments

  • supportandresistance 15-01.jpg
    supportandresistance 15-01.jpg
    186.3 KB · Views: 215
Hi everyone

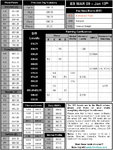
Please find attached todays levels. The S/R numbers are in the black column, the MP, Pivots, Fibs, Simple Moving Averages and Summary Numbers are for confluence and information.

Always remember to use the numbers as a guideline for potential areas of high probability plays.

Always use a set up based upon your system to enter a trade
.
Good trading all
 

Attachments

  • supportandresistance 16-01.jpg
    supportandresistance 16-01.jpg
    182.3 KB · Views: 155
I have admiration for your consistency in posting. I know you have no faith in indicators but I give you my 100% assurance that if you get the correct sequence of indicators on a chart then they can, and do, forecast the future.
Divergence is the most powerful tool available to traders but it must be fully understood and used in association with trendlines and support and resistance before effective control over the charts.
I have attached the 1hr chart of the S&P cash chart and will send the 15m chart in the next post.
I urge you strongly to look at divergence as an early warning, but unless you use daily charts, do not use the standard settings on any oscillator.
Good luck,
George
 

Attachments

  • S&P 60m CASH CHART.JPG
    S&P 60m CASH CHART.JPG
    76.7 KB · Views: 230
Here is the 15m timeframe of the S&P cash chart.
Good luck.
George
 

Attachments

  • S&P 15m CASH CHART.JPG
    S&P 15m CASH CHART.JPG
    110 KB · Views: 231
Hi George

Thanks for your message. Divergence is a great tool. Indicators are fine if they are not overused. I often observe divergence on the tick with my current style, in the past Stochastics was my favourite indicator, I traded divergences all day long. In my trading journey I have learnt the hard way that simplicity is the key to success (my success anyways). The bottom line is are you making money consistently? If your answer to that is yes, then it doesnt matter if you are trading using your horoscope! There is no right or wrong way, only YOUR way.
 
There is a wrong way - if you are guessing and winning.
George
Hi George

Thanks for your message. Divergence is a great tool. Indicators are fine if they are not overused. I often observe divergence on the tick with my current style, in the past Stochastics was my favourite indicator, I traded divergences all day long. In my trading journey I have learnt the hard way that simplicity is the key to success (my success anyways). The bottom line is are you making money consistently? If your answer to that is yes, then it doesnt matter if you are trading using your horoscope! There is no right or wrong way, only YOUR way.
 
Ha ha funny you say that. A friend of mine dissilusioned with losses made by people managing his money decided to have a go himself (hes very well off). Having read a tongue in cheek article about monkeys throwing darts at the stock listings and making more than professionals. He got a copy of the FT share listings put it up on the wall, and threw darts at it. I think he bought a different stock every 2 weeks and held each for a year. he made 23% that year on his money.

Now im not advocating that AT ALL, but it is interesting.

There is a wrong way - if you are guessing and winning.
George
 
He was lucky. My professional point is that that using divergence correctly brings huge benefits. It takes months to learn about it and even more months to practises it properly. I used to used Stochs also till I found something better.
If your friend had used a specialist chartist he would have made much more, and safely.
George
Ha ha funny you say that. A friend of mine dissilusioned with losses made by people managing his money decided to have a go himself (hes very well off). Having read a tongue in cheek article about monkeys throwing darts at the stock listings and making more than professionals. He got a copy of the FT share listings put it up on the wall, and threw darts at it. I think he bought a different stock every 2 weeks and held each for a year. he made 23% that year on his money.

Now im not advocating that AT ALL, but it is interesting.
 
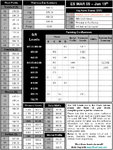
Hi everyone

Please find attached todays levels. The S/R numbers are in the black column, the MP, Pivots, Fibs, Simple Moving Averages and Summary Numbers are for confluence and information.

Always remember to use the numbers as a guideline for potential areas of high probability plays.

Always use a set up based upon your system to enter a trade
.
Good trading all
 

Attachments

  • supportandresistance 20-01.jpg
    supportandresistance 20-01.jpg
    186.2 KB · Views: 190
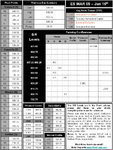
Hi everyone

Please find attached todays levels. The S/R numbers are in the black column, the MP, Pivots, Fibs, Simple Moving Averages and Summary Numbers are for confluence and information.

Always remember to use the numbers as a guideline for potential areas of high probability plays.

Always use a set up based upon your system to enter a trade
.
Good trading all
 

Attachments

  • supportandresistance 21-01.jpg
    supportandresistance 21-01.jpg
    177.5 KB · Views: 166
Hi everyone

Please find attached todays levels. The S/R numbers are in the black column, the MP, Pivots, Fibs, Simple Moving Averages and Summary Numbers are for confluence and information.

Always remember to use the numbers as a guideline for potential areas of high probability plays.

Always use a set up based upon your system to enter a trade
.
Good trading all
 

Attachments

  • supportandresistance 22-01.jpg
    supportandresistance 22-01.jpg
    186.9 KB · Views: 190
experiment

hi mate, remember I mentioned to you I was experimenting with VAH & VAL as inputs for Pivot Points rather than the session's actual high and low ?
(basing my theory on the Market Profile concept of where the Volume traded)
Seems to be working out quite interestingly, take a look at yesterday's action:

r_e
 

Attachments

  • MP 21 jan.jpg
    MP 21 jan.jpg
    123.5 KB · Views: 203
Yes it has been very interesting. I have been experimenting with it also, Our numbers are identical, except I think you have the midpoints points also?

I will continue to test

hi mate, remember I mentioned to you I was experimenting with VAH & VAL as inputs for Pivot Points rather than the session's actual high and low ?
(basing my theory on the Market Profile concept of where the Volume traded)
Seems to be working out quite interestingly, take a look at yesterday's action:

r_e
 
Last edited:
yep using mid points, using the same VAH/VAL to generate the Central Pivot number

I use the mid points as reversal triggers and the R1 & S1 as breakout/down triggers


however, as with my main thread ("ES Tonight"), I still can't make up my mind to go with which Equation - sometimes traditional FTP works well, other times Cams work better, other times, DeM are the best.
At the moment I trade all 3 set-ups even when they contradict each other.
I just wish I could settle on one calculation !

and now I'm experimenting with new input figures, the VAH/VAL, so I'm going crazy with 6 sets of triggers.

Does this mean that the approach is fundamentally flawed, that it's bollox because one set never achieves supremacy over another ? or does it mean I'll either just have to accept fewer signals by just using one set of equations, or continue to juggle using 3 sets of equations ?
 
That is why my friend I only use the pivots for confluence.

My set ups are based principally upon S/R levels, I use the pivots only to confirm the strength of a level.


yep using mid points, using the same VAH/VAL to generate the Central Pivot number

I use the mid points as reversal triggers and the R1 & S1 as breakout/down triggers


however, as with my main thread ("ES Tonight"), I still can't make up my mind to go with which Equation - sometimes traditional FTP works well, other times Cams work better, other times, DeM are the best.
At the moment I trade all 3 set-ups even when they contradict each other.
I just wish I could settle on one calculation !

and now I'm experimenting with new input figures, the VAH/VAL, so I'm going crazy with 6 sets of triggers.

Does this mean that the approach is fundamentally flawed, that it's bollox because one set never achieves supremacy over another ? or does it mean I'll either just have to accept fewer signals by just using one set of equations, or continue to juggle using 3 sets of equations ?
 
Hi everyone

Please find attached todays levels. The S/R numbers are in the black column, the MP, Pivots, Fibs, Simple Moving Averages and Summary Numbers are for confluence and information.

Always remember to use the numbers as a guideline for potential areas of high probability plays.

Always use a set up based upon your system to enter a trade
.
Good trading all
 

Attachments

  • supportandresistance 26-01.jpg
    supportandresistance 26-01.jpg
    189.7 KB · Views: 176
Back
Top