Indicators are liars! Support and Resistance Trading for the S&P emini

Hi everyone

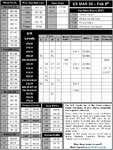
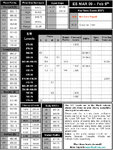
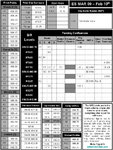
Please find attached todays levels. The S/R numbers are in the black column, the MP, Pivots, Fibs, Simple Moving Averages and Summary Numbers are for confluence and information.

Always remember to use the numbers as a guideline for potential areas of high probability plays.

Always use a set up based upon your system to enter a trade
.
Good trading all
 

Attachments

  • supportandresistance 27-01.jpg
    supportandresistance 27-01.jpg
    191.7 KB · Views: 212
contract size

I was wondering what contract size on the ES it's possible to trade before slippage becomes an issue. I have just switched over from the YM where even single contract orders were getting 2 or 3 points slippage.

To date I've only been trading 1 car on the ES but have had zero slippage, I was wondering how many contracts I can go up to before I need to think about scaling in/out. I know this all depends on volume and the time of day etc but a rough idea would be great. Am I right to assume that the ES would be generally better than the YM?
 
yep using mid points, using the same VAH/VAL to generate the Central Pivot number

I use the mid points as reversal triggers and the R1 & S1 as breakout/down triggers


however, as with my main thread ("ES Tonight"), I still can't make up my mind to go with which Equation - sometimes traditional FTP works well, other times Cams work better, other times, DeM are the best.
At the moment I trade all 3 set-ups even when they contradict each other.
I just wish I could settle on one calculation !

and now I'm experimenting with new input figures, the VAH/VAL, so I'm going crazy with 6 sets of triggers.

Does this mean that the approach is fundamentally flawed, that it's bollox because one set never achieves supremacy over another ? or does it mean I'll either just have to accept fewer signals by just using one set of equations, or continue to juggle using 3 sets of equations ?

very very interesting stuff.

am playing with this atm.

am mixing up pivots and VAH / POC /VAL will let you know the results 👍
 
Hi everyone

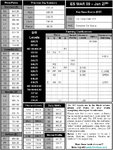
Please find attached todays levels. The S/R numbers are in the black column, the MP, Pivots, Fibs, Simple Moving Averages and Summary Numbers are for confluence and information.

Always remember to use the numbers as a guideline for potential areas of high probability plays.

Always use a set up based upon your system to enter a trade
.
Good trading all
 

Attachments

  • supportandresistance 28-01.jpg
    supportandresistance 28-01.jpg
    194.4 KB · Views: 179
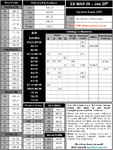
Hi everyone

Please find attached todays levels. The S/R numbers are in the black column, the MP, Pivots, Fibs, Simple Moving Averages and Summary Numbers are for confluence and information.

Always remember to use the numbers as a guideline for potential areas of high probability plays.

Always use a set up based upon your system to enter a trade
.
Good trading all
 

Attachments

  • supportandresistance 29-01.jpg
    supportandresistance 29-01.jpg
    193.7 KB · Views: 157
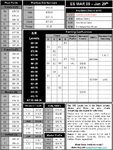
Hi everyone

Please find attached todays levels. The S/R numbers are in the black column, the MP, Pivots, Fibs, Simple Moving Averages and Summary Numbers are for confluence and information.

Always remember to use the numbers as a guideline for potential areas of high probability plays.

Always use a set up based upon your system to enter a trade
.
Good trading all
 

Attachments

  • supportandresistance 30-01.jpg
    supportandresistance 30-01.jpg
    188 KB · Views: 149
In an early thread you mentioned about doing a tutorial, I would really appreciate one if it was available. I am quite new to trading and am making a concious decision to learn to trade using Support, Resistance and price action. Any help would be appreciated.
 
I have attached a 1 hour chart for the SP500 daily which I am attempting to trade. I have chosen this as it is not too volatile while I try and learn the SR mthod of trading.

If you disregard the 30th January on the chart, where would you enter S and R lines?

Thanks for helping
Lee
 

Attachments

not quite sure what it is you're asking, but based on the OHLC visible on the chart, i come up with approximate figures:
R2 @ 916.5
R1 @ 876
mid @ 857.5
PP @ 838.75
mid @ 818.5
S1 @ 798.5
S2 @ 761

but as i said, i'm not clear if that's what you're asking for ?

Anyway, sorry to butt in, back over to aamarx, it's his thread, sorry to interrupt....
 
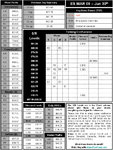
Hi everyone

Please find attached todays levels. The S/R numbers are in the black column, the MP, Pivots, Fibs, Simple Moving Averages and Summary Numbers are for confluence and information.

Always remember to use the numbers as a guideline for potential areas of high probability plays.

Always use a set up based upon your system to enter a trade
.
Good trading all
 

Attachments

  • supportandresistance 02-02.jpg
    supportandresistance 02-02.jpg
    195.7 KB · Views: 168
Hi,

Thanks for eplying to my post and taking the time to send some figures through. What I was trying to see was how guys like yourself who have far more experince then myself, look at charts and pick real levels of support and resistance. I have a tendency to choose levels that are very weak and not real levels. This is because I am sometimes fearfull of missing out on a trade. What normally tends to happen is I get in far too early and then lose my trade only to watch a more prominant support / resistance area hit which would have been the better trade.

My goal over the next few months is to learn to select true ranges of support and resistance to help give me a better probability of success.

Cheers
Lee
 
Hi Lee

Just noticed your message.

Best thing to do is if you go to my blog at Support and Resistance Trading for the S&P emini or look through the worksheet posts on the forum you will find the levels posted for each trading day many hours before the open of that day. I think this will help you find what you need. The key imo to S/R is to be obvious, big spikes, levels used in the past etc. If you can see it clearly so can everyone else, I think that is the key you are not looking for something hidden. It has to be clear.


I have attached a 1 hour chart for the SP500 daily which I am attempting to trade. I have chosen this as it is not too volatile while I try and learn the SR mthod of trading.

If you disregard the 30th January on the chart, where would you enter S and R lines?

Thanks for helping
Lee
 
Last edited:
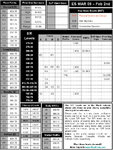
Hi everyone

Please find attached todays levels. The S/R numbers are in the black column, the MP, Pivots, Fibs, Simple Moving Averages and Summary Numbers are for confluence and information.

Always remember to use the numbers as a guideline for potential areas of high probability plays.

Always use a set up based upon your system to enter a trade
.
Good trading all
 

Attachments

  • supportandresistance 03-02.jpg
    supportandresistance 03-02.jpg
    199.2 KB · Views: 199
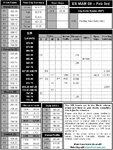
Hi everyone

Please find attached todays levels. The S/R numbers are in the black column, the MP, Pivots, Fibs, Simple Moving Averages and Summary Numbers are for confluence and information.

Always remember to use the numbers as a guideline for potential areas of high probability plays.

Always use a set up based upon your system to enter a trade
.
Good trading all
 

Attachments

  • supportandresistance 04-02.jpg
    supportandresistance 04-02.jpg
    197.8 KB · Views: 172
Tick Chart

Hello,

Thanks for all the free information on S & R levels!

Is there anyway we can be shown how to draw these levels? My charting service has a lot of these pivots automatically via studies however the levels seem to be different? I use Sierra Charts.

What size tick chart do you use to confirm with the 1minute chart. You mentioned you used a 1minute chart and a 1minute tick chart, not sure how to define a 1minute tick chart, about 50-60ticks?

I have attached a 1minute and 50 tick chart with all your 55 pivots + bolling bands and stochastic crossover arrows.
 

Attachments

  • 1minute.png
    1minute.png
    28.8 KB · Views: 183
  • 50tick.png
    50tick.png
    30.5 KB · Views: 236
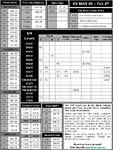
Hi everyone

Please find attached todays levels. The S/R numbers are in the black column, the MP, Pivots, Fibs, Simple Moving Averages and Summary Numbers are for confluence and information.

Always remember to use the numbers as a guideline for potential areas of high probability plays.

Always use a set up based upon your system to enter a trade
.
Good trading all
 

Attachments

  • supportandresistance 05-02.jpg
    supportandresistance 05-02.jpg
    202.1 KB · Views: 158
Hello,

Thanks for all the free information on S & R levels!

Is there anyway we can be shown how to draw these levels? My charting service has a lot of these pivots automatically via studies however the levels seem to be different? I use Sierra Charts.

All we are about is the S/R levels in the Black column, if you read the notes on the worksheet it explains that briefly.

What size tick chart do you use to confirm with the 1minute chart. You mentioned you used a 1minute chart and a 1minute tick chart, not sure how to define a 1minute tick chart, about 50-60ticks?

I dont use a tick chart, its a $tick chart, confusing I know, but the $tick is an index Tick Index

I have attached a 1minute and 50 tick chart with all your 55 pivots + bolling bands and stochastic crossover arrows.

woooah, thats definetly not what I want you to do, only the 15 or so numbers in the black column are what we look at, the other pivot levels are just for confluence, they show use what other market participants are looking at. The table in the middle shows us when those "other" pivots coincide with our S/R levels.
 
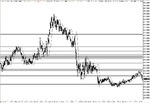
Hi everyone

Please find attached todays levels. The S/R numbers are in the black column, the MP, Pivots, Fibs, Simple Moving Averages and Summary Numbers are for confluence and information.

Always remember to use the numbers as a guideline for potential areas of high probability plays.

Always use a set up based upon your system to enter a trade
.
Good trading all
 

Attachments

  • supportandresistance 06-02.jpg
    supportandresistance 06-02.jpg
    193.2 KB · Views: 178
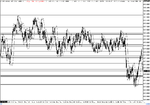
Hi everyone

Please find attached todays levels. The S/R numbers are in the black column, the MP, Pivots, Fibs, Simple Moving Averages and Summary Numbers are for confluence and information.

Always remember to use the numbers as a guideline for potential areas of high probability plays.

Always use a set up based upon your system to enter a trade
.
Good trading all
 

Attachments

  • supportandresistance 10-02.jpg
    supportandresistance 10-02.jpg
    192.1 KB · Views: 171
Back
Top