You are using an out of date browser. It may not display this or other websites correctly.
You should upgrade or use an alternative browser.
You should upgrade or use an alternative browser.
I have found the Holy Grail indicator for the Dow Jones - 100% right so far
batsonar
Experienced member
- Messages
- 1,438
- Likes
- 126
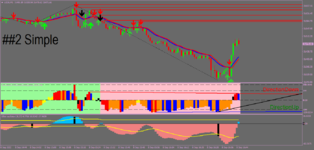
This is my MVMF indicator. As you can see it looks like the blue line is about to cross zero to the upside. The indicator is reading -7.85. This is a "BUY" signal which means that the DOW could be about to make a move to the upside in the short to mid-term. Be aware that because the blue line has not quite crossed the zero line it could still fall to the downside.

Last edited:
TEAMTRADER
Active member
- Messages
- 207
- Likes
- 86
batsonar
Experienced member
- Messages
- 1,438
- Likes
- 126
No the video wasn't relevant anymore. I use different indicators now to the one in the video so I thought it best that I delete the video. I have come along way in trading since that video was posted.Batsonar, I wanted to read the whole thread, but I see that the video in the 1st post has disappeared. What happened to it? Is it no longer relevant?
Last edited:
TEAMTRADER
Active member
- Messages
- 207
- Likes
- 86
batsonar
Experienced member
- Messages
- 1,438
- Likes
- 126
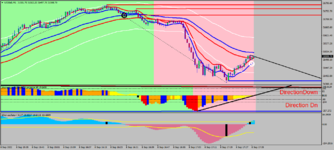
This is my Selling Buying Volume Oscillator. As can see there has been a sharp increase in buyIng volume today and the indicator is about to cross the zero level back into the "GREEN" (positive volume). This could mean that the DOW is about to make a move to the upside in the short to mid-term.

Last edited:
batsonar
Experienced member
- Messages
- 1,438
- Likes
- 126
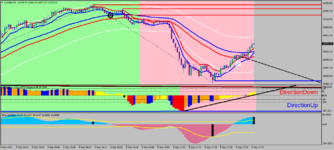
This is my EzAlgo indicator. If you look at the chart below you will see a blue X just under the last candle. This is called a mild "BUY" signal on EzAlgo. These signals are not always right but they are useful. This means that the DOW could be about to make a move to the upside in the short to mid-term.

batsonar
Experienced member
- Messages
- 1,438
- Likes
- 126
I have just been experimenting with another indicator from the platform I use. I call it my "BATSONAR" indicator. There is no lag on the indicator and it also doesn't repaint. I just back tested it from the 24th March 2020. There were a total of 164 trades. I had 134 winning trades against 30 losing trades. This means that this strategy has a win rate of 81.7% which is extremely high. This means I should be accurate 81% of the time in predicting the next day or so, move on the DOW. I only trade at the end of the trading day on the DOW. This indicator is about as Holy Grail as you are going to get.
Last edited:
Lord Flasheart
Legendary member
- Messages
- 9,826
- Likes
- 985
Sure but is it profitable. That sort of thing works better with optionsI have just been experimenting with another indicator from the platform I use. I call it my "BATSONAR" indicator. There is no lag on the indicator and it also doesn't repaint. I just back tested it from the 24th March 2020. There were a total of 164 trades. I had 134 winning trades against 30 losing trades. This means that this strategy has a win rate of 81.7% which is extremely high. This means I should be accurate 81% of the time in predicting the next day or so, move on the DOW. I only trade at the end of the trading day on the DOW. This indicator is about as Holy Grail as you are going to get.
Last edited:
batsonar
Experienced member
- Messages
- 1,438
- Likes
- 126
Yes the back testing was profitable. Some really big moves on the US some days. What platform do you recommend for options trading. What company can I use? I trade CFD's at the moment.Sure but is it profitable. That sort of thing works better with options
Lord Flasheart
Legendary member
- Messages
- 9,826
- Likes
- 985
If you want to spread bet, then IG porbably best for daily optionsYes the back testing was profitable. Some really big moves on the US some days. What platform do you recommend for options trading. What company can I use? I trade CFD's at the moment.
Lord Flasheart
Legendary member
- Messages
- 9,826
- Likes
- 985
you need to backtest with targets and stops. The 81% figure includes days when the market goes against you before coming back so it is very missleading. If you are using options then the % value of the spreads is bigger but ofcourse you would make a profit on 81% of the tradesIf you want to spread bet, then IG porbably best for daily options
batsonar
Experienced member
- Messages
- 1,438
- Likes
- 126
I don't use targets as such. I wait till the end of the trading day or the next few days to close a trade depending on what the indicator is showing. Sometimes I close intraday if I'm in profit. The 81% win rate were profitable trades on the next trading day or so. As regards a stop loss to you need to be generous to take into a account the days fluctuations. To tight a stop loss and you are most likely going to be stopped out. I have been thinking is it even worth using a stop loss and just take the loss at the end of the trading day. My system would still have been profitable.you need to backtest with targets and stops. The 81% figure includes days when the market goes against you before coming back so it is very missleading. If you are using options then the % value of the spreads is bigger but ofcourse you would make a profit on 81% of the trades
Last edited:
AriaS
Well-known member
- Messages
- 382
- Likes
- 123
I see.. What posts should I start reading from in order to catch up with your new trading ways?No the video wasn't relevant anymore. I use different indicators now to the one in the video so I though it best that I delete the video. I have comes along way in trading since that video was posted.
batsonar
Experienced member
- Messages
- 1,438
- Likes
- 126
About the last 2 pages. I have only really just started with the new indicator I am using. The buy and sell signals previously were a bit hit and miss but the signals I give from now on should be more accurate.I see.. What posts should I start reading from in order to catch up with your new trading ways?
AriaS
Well-known member
- Messages
- 382
- Likes
- 123
Great! Will try and keep up. I've always wanted to learn how to trade the indices.About the last 2 pages. I have only really just started with the new indicator I am using. The buy and sell signals previously were a bit hit and miss but the signals I give from now on should be more accurate.
Similar threads
- Replies
- 50
- Views
- 18K
- Replies
- 0
- Views
- 2K


