You are using an out of date browser. It may not display this or other websites correctly.
You should upgrade or use an alternative browser.
You should upgrade or use an alternative browser.
Best Thread How To Make Money Trading The Markets.
- Thread starter Mr. Charts
- Start date
- Watchers 310
For those using IB, and dealing with all those cumbersome windows, using the 'Groups' function is awesome. Make the main quote page, a chart, Market Depth window and T&S window all part of the same group, then when you click on a different symbol in the main quote page, the symbol changes on all the pages!
This may be old news for some, but it's awesome for new users of these IB tools!
Adrian
This may be old news for some, but it's awesome for new users of these IB tools!
Adrian
Are there any recommendations for learning the Order Flow? I have it up on screen when I'm trading, and I think I see (sometimes, rarely) what could be fuzzily described as bullish or bearish behaviour, but I'm not sure how I should be learning. Should you actively monitor? If so, what key details does one observe, or is it best viewed passively, just watching it as the price action takes place.
Also, how do I know if I'm looking at realistic flow, and not gibberish? More than once Richard has noted that many times the Order Flow, or Market Depth is just rubbish and he cannot use it as an indicator to guage future price action.
Any help is appreciated!
Adrian
Also, how do I know if I'm looking at realistic flow, and not gibberish? More than once Richard has noted that many times the Order Flow, or Market Depth is just rubbish and he cannot use it as an indicator to guage future price action.
Any help is appreciated!
Adrian
You may have found out by now but to plot High/Low of yesterday on IB charts you need to subscribe to eSignal data and then IB will give you the option to plot it.
Cheers
steve
Cheers
steve
Has anyone found a way to show previous day's high / low on IB's charting software? As far as I knew this feature is not available other than by manually drawing lines.
You may have found out by now but to plot High/Low of yesterday on IB charts you need to subscribe to eSignal data and then IB will give you the option to plot it.
That's gay. Subscribe to a superior charting software and we'll let you plot their lines on our inferior charts?
The only reason choose TWS is cos ESignal is too expensive.
If only TWS had the opportunity to program your own indicators. Oh wait, it does! Never tried it though. See link
For those using IB, and dealing with all those cumbersome windows, using the 'Groups' function is awesome. Make the main quote page, a chart, Market Depth window and T&S window all part of the same group, then when you click on a different symbol in the main quote page, the symbol changes on all the pages!
This may be old news for some, but it's awesome for new users of these IB tools!
Adrian
Give the boy a banana.
PS: It's the same on all charting packages i know! Ninja, Sierra, Worden, ESignal, Amibroker.....
You may have found out by now but to plot High/Low of yesterday on IB charts you need to subscribe to eSignal data and then IB will give you the option to plot it.
Cheers
steve
Just wondered whether there Is a way to get it from one of the free EOD data providers and display it on IB's chart?
I am trying to use the IB's market scanner for scanning for stocks that are 'moving' to trade. The scanner has quite a few parameters (though seems you can only select one parameter at a time), a few I have listed below. My question is, from people's experience and/or understanding, which of the parameters listed below would be best to use to scan for the type of stocks that can be traded Mr. Charts' style? Many thanks.
Top % Gainers
Top % Losers
Most Active
Hot Contracts by Volume
Top Trade Count
Top Trade Rate
Top Volume Rate
Top % Gainers Since Open
Top % Losers Since Open
Highest Option Imp Vol
Lowest Option Imp Vol
Top Option Imp Vol % Gainers
Top Option Imp Vol % Losers
Most Active by Opt Vol
Most Active by Opt Open Interest
Hot By Opt Volume
13-Week High
13-Week Low
26-Week High
26-Week Low
52-Week High
52-Week Low
I am trying to use the IB's market scanner for scanning for stocks that are 'moving' to trade. The scanner has quite a few parameters (though seems you can only select one parameter at a time), a few I have listed below. My question is, from people's experience and/or understanding, which of the parameters listed below would be best to use to scan for the type of stocks that can be traded Mr. Charts' style? Many thanks.
Top % Gainers
Top % Losers
Most Active
Hot Contracts by Volume
Top Trade Count
Top Trade Rate
Top Volume Rate
Top % Gainers Since Open
Top % Losers Since Open
Highest Option Imp Vol
Lowest Option Imp Vol
Top Option Imp Vol % Gainers
Top Option Imp Vol % Losers
Most Active by Opt Vol
Most Active by Opt Open Interest
Hot By Opt Volume
13-Week High
13-Week Low
26-Week High
26-Week Low
52-Week High
52-Week Low
Danjuma,
I used IB's "Top % Gainers" and "Top % Losers" for a little while. To me, they seem to be close to what this thread is looking for. It didn't quite give me what I wanted, so I am trialling Trade-Ideas.
That said, the IB data, along with knowledge of news stocks for the day are probably enough to satisfy the requirements for finding the kinds of stocks Richard looks for.
Cheers,
Adrian
That said, the IB data, along with knowledge of news stocks for the day are probably enough to satisfy the requirements for finding the kinds of stocks Richard looks for.
Many thanks for your reply Adrian.
When you say "...the IB data...", what data are you referring to? Thanks
I mean the Data provided by the IB Market Scanner - greatest gainers and losers.
Thank you. 🙂
One of the things I have taken from this journal is that not every trade needs to be a homerun. If you can take a few cents out of every trade, and winners are a few times the size of losers, that's all you need to grow your equity and be profitable.
Thanks for the lessons!
Adrian
Thanks for the lessons!
Adrian
Mr. Charts
Legendary member
- Messages
- 7,370
- Likes
- 1,200
ProfessorK
Junior member
- Messages
- 16
- Likes
- 1
Richard,
No more 10 EMA?
I have also noticed no lines of previous days hi / lo's or support / resistance.
I realize you may have all this info in your head and may not need to draw them out on your charts like us less adept traders do. However are these all still important factors your considering while trading?
Thank you for continuing your posts.
Kevin
Mr. Charts
Legendary member
- Messages
- 7,370
- Likes
- 1,200
Richard,
No more 10 EMA?
I have also noticed no lines of previous days hi / lo's or support / resistance.
I realize you may have all this info in your head and may not need to draw them out on your charts like us less adept traders do. However are these all still important factors your considering while trading?
Thank you for continuing your posts.
Kevin
Hi Kevin,
Yes, I still use them.
Email me if you wish.
Richard
Mr. Charts
Legendary member
- Messages
- 7,370
- Likes
- 1,200
I'm posting all my stock trades on my blog on my website - winners and losers !
Richard
Richard
Mr. Charts
Legendary member
- Messages
- 7,370
- Likes
- 1,200
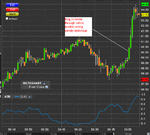
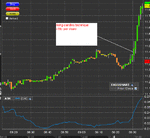
All 13 of my techniques also work well on ETFs (exchange trade funds).
For example, FAS, which is a highly liquid ETF which, (together with FAZ) work well in moving financial markets.
FAS is a financial bull stock ETF - yes, trade what's happening, not what the so called economic experts and news journos say.
Here's an example from just after market open today using the rising candles technique discussed in this thread.
+38c per share
All my trades will go on my blog later today or tomorrow morning.
Richard
Attachments
Similar threads
- Locked
- Replies
- 2
- Views
- 4K


