Best Thread How To Make Money Trading The Markets.

hold on do u trade swing or intraday ?
cause I would not trade with IB for intraday stocks. that' just plainly terrible you have no buying power. it's all about leverage, commission and speed, reliability

IB works quite well for me...don't know what problems you're talking about. Leverage is more than sufficient, commissions are really nothing and better than most other brokers I've seen and execution speed is brilliant (it takes me longer to move my eyeballs to my broker screen and by that time, the trade is already filled).
 
lol you dont even understand my question. are you a day trader or swing ?
personally I am a scalper and I need to have the best platform,leverage,comm,fees, and speed and of course chart and data feeds.
i use ninjatrader w zenfire and my broker is ampfutures
since I am a daytrader, my leverage is pretty high.
1 crude or gold contract = $1000
1 currency contract = $500 (Aussie,Euro,GBP)
1 ES contract = $400

I dont think IB can match these margin let alone, im not sure about comm and fees.
but IB platform,DOM and charts are inferior compare to ninja


IB works quite well for me...don't know what problems you're talking about. Leverage is more than sufficient, commissions are really nothing and better than most other brokers I've seen and execution speed is brilliant (it takes me longer to move my eyeballs to my broker screen and by that time, the trade is already filled).
 
i use ninjatrader w zenfire and my broker is ampfutures
since I am a daytrader, my leverage is pretty high.
1 crude or gold c
1 currency c (Aussie,Euro,GBP)
1 ES c

I dont think IB can match these margin let alone, im not sure about comm and fees.
but IB platform,DOM and charts are inferior compare to ninja
Hi Tommason,
For futures, you may well be right in thinking that there are other brokers out there that offer better RT comm's than IB. I use Infinity Futures myself. However, this thread is in the US Stocks sub-forum, so the focus is on trading U.S. equities - not futures. For that purpose, IB are well worth considering and, indeed, I used them myself when I traded stocks a few years back.
- - - - - - - - - - - - - - - - - - - - - - - - - - - - - - - - - - - -

Hi sh5467,
I'm not up to speed on what's available now, but the PDT rule is a difficult one to get around with reputable brokers registered with the appropriate regulatory bodies. I believe there are some brokers operating outside the jurisdiction of the U.S. that will allow you to deposit smaller sums - but I certainly can't recommend any. Your next best option (that I'm aware of) is to look into a DMA CFD account, i.e. one in which you pay commission, which is most of them these days I believe.

If you're not familiar with CFDs and how they differ to spread betting (many SB companies offer CFDs as well), check out this FAQ: What are the Pros and Cons of Spread Betting Vs CFDs?
Enjoy!
Tim.

Thanks Tim. That is pretty much where I am at present with MF Global CFD direct market access account.
 
MF Global are charging me 2c per share with a $20 min compared to IB's 0.005c per share with $1 minimum. Essentially they are 4 times the cost. I don't think it is viable to trade at these commission levels if you are in and out of several stocks intraday.
 
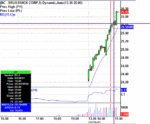
I picked BC up on a scan for largest movers and although it was a high probability trade it could have been better as it had already been trending for a while and, of course, you always think it might be due to retrace/reverse. However, I could see there was plenty of buying pressure and little on offer so the probability was that it would continue. Had it reversed I'd simply have exited straightaway. I don't see the point in waiting for a stop loss to be hit if you can see price is reversing against you. If it had merely faltered and chopped around (wiggled) I'd have stayed in to see what would have happened. If it had turned against me as soon as I entered I'd have exited for a loss of maybe 2c to 4c.
However, it continued up as the evidence in front of my eyes suggested it would.
Of course if I'd run the scan a few minutes before I'd probably had been in earlier.
Entry on the red cross hairs and exit at the time of the screen shot.
In fact I exited at what proved to be the highest bid of the day. The buying pressure stopped and the selling pressure intensified, so I wasn't going to wait around for the chart to reflect the trades after people started to get out. It's possible that might have just been temporary and it could have gone up again, but my attitude is to take what is lying around waiting to be picked up. If the evidence in front of your eyes says the move MIGHT be over, take what's there.


Richard

I don't understand why you didn't exit at 25.6 since the candlestick indicated a downturn at that point. Can you clarify?
 
A couple of trades using this method from today which illustrate different points worth being aware of, imho.
First a loser, SWN. I went long on rising candles and within seconds it turned against me and since one of the keys to successful trading is to keep losers small, I exited as soon as it turned south. No maybes, ifs, altering stop losses, wishing, hoping and all that nonsense, OUT and take the small loss of 5c. It's the cost of doing business, simple as that.
Difficult to understand the chart? Look at the red X hairs, that was the point of entry. Time of exit on the screen shot and was on the same candle.
Richard

Hi Richard,
Many thanks for lots of input on this thread from which i learnt a lot.
Could i ask how do you know the price was going down before the bar was closed?
Thanks for your advice.
 
OK - let me first say - THIS IS MY OWN WORK - if someone wants to claim breach of copyright on this - please prove it.

Take a look at the screen shot attached.

Put the indicator on a radar screen and sort by "Trend" - hey presto, all the stocks from your list that are trending and at high/low of the day as per Mr Charts method will be at the top.

I hope it helps. I find 3 min bars suit me the best.

Trend - no of bars trending (only displayed if high/low of day)
Risk - distance from prior bar high/low (your exit point as per the strategy)
ATR - errr... ATR
QTY - max number of shares you should trade based on the higher of the ATR or Risk cents. You need to tell it your account size & risk % for this to be accurate

Any issues - PM me or post here & I'll update it.

Next step of course is a program to handle the exits once you are in a trade. So - you could just hit a button when you get in & then just let TS handle the exist whilst you look for other opportunities.

Cheers

Pete

Hi
Pedro does trade station have the same sought of scanner as esignal which i think Richard uses and can you tell me about the different types of scans trade station can do.
I am looking to go on a 1:2:1 course with Richard soon. Any other pointers wauld be great.
Regards
Simon
 
I don't understand why you didn't exit at 25.6 since the candlestick indicated a downturn at that point. Can you clarify?

The trade had not been stopped out using the chart exit method I have described on this thread. neither had there been overwhelming sell pressure on L2 T&S.
Richard
 
Hi Richard,
Many thanks for lots of input on this thread from which i learnt a lot.
Could i ask how do you know the price was going down before the bar was closed?
Thanks for your advice.

peter66,
My pleasure.
As I've said earlier in the thread, I have two potential exits; the first being the chart exit; the second which trumps the chart exit is what is happening on L2 T&S. If I'm long a position and the latter tells me there is suddenly strong selling coming in and the buy pressure is shrinking then I'll exit without waiting for the chart signal.
As I've said before you can trade this method purely using charts but L2 T&S gives me a big edge, (not certainty, but higher probability) in anticipating the probability of a continuation or reversal. It's like a scalper's entry and exit tool added to the chart signal.
Hope that helps,
Richard
 
The trade had not been stopped out using the chart exit method I have described on this thread. neither had there been overwhelming sell pressure on L2 T&S.
Richard

Looking at the chart the top of the candlestick did cross the lower end of the prior candlestick so surely that is your exit criteria - but I take it was level 2 that made you not exit. I have outlined with a purple line where I expect by your chart exit method I have read in the first post you should have exited - I would be grateful if you could clarify this.
 

Attachments

  • 250311BC.GIF
    250311BC.GIF
    19 KB · Views: 263
goldmember1,

"Looking at the chart the top of the candlestick did cross the lower end of the prior candlestick so surely that is your exit criteria "

I'm sorry, but that doesn't make sense to me at all.
 
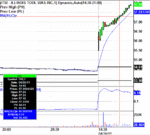
ITW set up nicely and was a pre-market choice, not a scan during the market.
+60c per share
Exit was on L2 T&S as I could see the buying was PROBABLY coming to an end. I didn't wait for the bottom of the previous candle to be taken out before exiting. Had I done so I'd still have made good money, 13c less than I did. That chart exit occured 2 minutes later but I was out on what proved to be the high candle of the swing.
Results today were:
+10c per share
+60c
-6c
+11c
+16c
-4c
+67c

Richard
 

Attachments

  • 260411ITW.GIF
    260411ITW.GIF
    17.5 KB · Views: 248
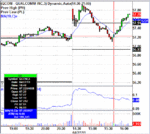
The trailing exit system in this thread can be used in other situations, for example one of my trades this afternoon.
QCOM +47c per share
This was a nice slow swing move in a very low ATR stock, nothing hurried, plenty of time to make decisions.
This is why I love day trading US stocks - always opportunities even on slow days.

All trades today so far:
+30c
+10c
+51c
-7c
+58c
-8c
+47c
 

Attachments

  • 270411QCOM.GIF
    270411QCOM.GIF
    22 KB · Views: 279
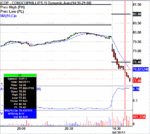
Look at this one this afternoon.
Not rocket science, imho.
No bad for four minutes.
Set-up blindingly obvious.
COP + 58c per share

All trades so far:
+58c per share
-6c
-5c
-5c
+1c
+15c
+22c (average gain as I scaled out 50% at a time)

Richard
 

Attachments

  • 280411COP.GIF
    280411COP.GIF
    18.8 KB · Views: 334
Back
Top