Best Thread How To Make Money Trading The Markets.

Thank you to everyone who has posted positive contributions and to all those who have emailed.
Anyone new trying this method should, as I've said before, extensively test it for themselves paper trading before using real money.
I'm perfectly happy to answer EMAILS from people provided they include their t2w handles and have actually read the thread. However, those who have emailed questions before and have not even had the courtesy to reply with a simple "thanks" will not receive any further help. Neither will I provide answers which I've already written in the thread.
There have been some emails asking for the charts which I mentioned in post #1299 so I'll put them up here.
Richard
 
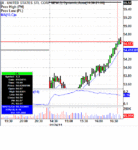
Here's one from today. It's a little different as it's much earlier in the trading day, but the principle is the same. As always red X hairs on point of entry and image at time of exit.
This had a large range but you can reduce position size accordingly so your dollar risk remains the same and is related to the ATR and the candle low as described earlier in the thread.
The exit was because I could see on Level 2 T&S that resistance was building. The price pushed up just a little more before dying and the candle I exited on proved to be the highest of the day (so far).
NFLX +70c net profit per share (there was a spread of a few cents, as is common on high priced stocks).
Richard

The ATR on this trade post #1142 is extremely high which according to your post #43 and makes it very risky and difficult to trade successfully. The spread on this stock is always wide and that makes it very difficult to get out with a decent profit.
 
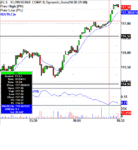
Finally CTXS for a very satisfactory $2.02 per share.
The exit was because I could see buying coming in.
You do get failures with this method like with any, but the key is to keep them small.
Richard

The ATR on this trade post #1156 is 35. That makes it a very risky trade. Stocks with high ATR's also have wide spreads which are not shown on charts. This makes charts unreliable as the only reason to take a trade.
 
Re- post 1277
I've had several emails asking for the chart, so here it is.
+$2.97 per share

Happy Christmas and New Year to everyone 🙂
Richard

The ATR on this trade post #1283 was 55 and a wide spread to go with it. This goes against the main methods of this thread. We want to take trades that are readable on level II & time and sales with a chart set up. This trade with the high ATR would give the average trader a high level of stress. Not to mention a big loss because of its volatility.
 
The ATR on this trade is 35. That makes it a very risky trade. Stocks with high ATR's also have wide spreads which are not shown on charts. This makes charts unreliable as the only reason to take a trade.

I think that if you look back through the thread you will see that he applies some other criteria to his trades.

Another thing that is difficult for him to relate in the thread is that he has a history of certain trades being relatively successful, similar to a 'feel' of the market based on many many trades.
 
Mr. Charts -- I recently discovered T2W and just finished reading this entire thread for the first time. Gladly, this is one of the initial T2W threads I looked at and, like a good book, I had a hard time taking breaks from the thread and couldn't wait to come back for more until I finished it this evening. How refreshing it has been when compared to all the other trading information that I've absorbed (or perhaps failed to) during my rookie year trading part time and with disappointing results. I'm extremely grateful for your generous efforts and the opportunity to learn and benefit from all that you've shared in this thread. I'm also grateful to the many others who have made productive comments in this thread. I've just started the past two days sim-trading what I gleaned of your set-up and rules and it certainly seems to be working! Please keep posting. Thank you!!!

I live in California, so I can only trade the first hour of the US equities market before I have to leave for my office. Judging from a number of your posts and charts, your set up is quite useable during the first market hour, correct?

Many, many thanks again for all you've shared. A happy, healthy and prosperous new year to you and your family.

Jim

Jim, skimovie, any more questions or even posts to add to your T2W total of 1? 🙂
 
I keep checking this thread to learn more, and I continue looking into the feasibility of trading the first US equities market hour or Forex. It is a slow process for me as a newbie with a full-time carreer and family... trading and learning time is limited. Richard has been kind enough to answer a couple of my questions via email and I really appreciated his insights and encouragement. I also appreciate all the other sincere and helpful contributors on this thread. Thanks again to all who have productively contributed to this thread and the others on T2W.

Jim

Funny..you type just like Richard 🙂
 
I keep checking this thread to learn more, and I continue looking into the feasibility of trading the first US equities market hour or Forex. It is a slow process for me as a newbie with a full-time carreer and family... trading and learning time is limited. Richard has been kind enough to answer a couple of my questions via email and I really appreciated his insights and encouragement. I also appreciate all the other sincere and helpful contributors on this thread. Thanks again to all who have productively contributed to this thread and the others on T2W.

Jim

that's wonderful....now can he provide us with his NFA futures regulated pfgbest broker statement ? no need for endless threads and posts- show us that trading statement and we will invest in his PAMM.
 
that's wonderful....now can he provide us with his NFA futures regulated pfgbest broker statement ? no need for endless threads and posts- show us that trading statement and we will invest in his PAMM.

No reason for him to show his statement...... just learn his method and then you would not have to pay him a management fee for his Pamm account.

The thing is like this, he posts stuff in here to share. and now you want him to qualify, and it is you that has to learn to trade..!!
 
Do I really have to read over 1300 post to get to the bottom of this?. lol Will Mr. charts please delete out all the chitty -chatt from other's on this thread and compile his views of his system. If that cannot be done then start on post #1336 please, thank you. =] Then I would like to start reading about the system. =]
 
Two trades from today using this method, including a loser.
As anyone who has read the thread knows, I suggest anyone interested tests the method for themselves, maybe 100 times before they actually trade it.
Anyone with a question who has actually read the thread is welcome to EMAIL me and I'll try and help, but do include your t2w nick.
t.b.c
 
I traded 10 times today and had two losers.
Here's one using this method.
Lost -6c per share.
 

Attachments

  • 240111X.GIF
    240111X.GIF
    20.8 KB · Views: 244
Also as mentioned and explained many times, position size according to ATR and personal risk.
And it's no good saying this stock has a spread of 5c. That's equivalent to 1c on a $22 stock and if you know what you're doing and the stock isn't moving too quickly you can trade within the spread anyway, though you might miss the trade doing that.
This was FLS and this particular trade produced a profit of 48c per share.
It's a nice easy clean one and requires no further explanation about entry point - it's obvious. I exited at the time of the screen shot as per the chart rule for exit - again explained many times on this thread.
Richard
 

Attachments

  • 240111FLS.GIF
    240111FLS.GIF
    19.3 KB · Views: 227
This method of trading is a skill acquired by continual scanning and backtesting and some tweaking to find what is comfortable for the individual trader.

There is not a universal rule to be applied for all traders...., continual testing is the way to acquire the skill and intuition for entries.

I have a hunch that Mr Charts is eyeballing his trade candidates critically all day long with a view as to what will or will not work on a particular chart or day..... and he can do that in order to make his decisions because he has been studying thousands of charts...

Sorta like, the scans will show certain things but the trader himself has to be in harmony with price action.
 
Blaiserboy,
Certainly, as in most things in life, you improve with increasing experience.
The cleaner and clearer the set up the more likely it is to be successful, the less clear ones tend to have a lower success rate. In a sense that is similar to your third paragraph.
As for "in harmony with price action" that is absolutely spot on.
For example, you cannot trade this way purely on the basis of deciding to take a trade if price reaches a pre-determined level. HOW it reaches that level is very important. Does it slowly tick to it, or is there a flurry of trades and visible momentum.
For example, take the FLS trade. I only spotted it a couple of minutes before the entry, I alerted my members in advance of taking the trade as I always do. However, if the price would merely have slowly got to that level, I wouldn't have taken the trade. The confirming trigger was the rush of buying.
It's a pleasure to read a constructive and intelligent contribution like yours. Thank you.
Richard
 
Back
Top