Best Thread How To Make Money Trading The Markets.

You seem to be forgetting the tax issue.

Assuming people have not acquired their wealth illegally, they have most likely paid 20% - 50% of it to the state in taxes. The state then spends it wisely to the general betterment of society :D

Would this issue be better discussed on another thread (do a search - the tax issue has several threads) in order to keep this thread focussed on trades?
 
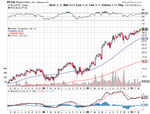
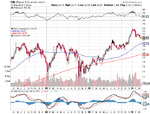
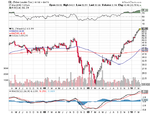
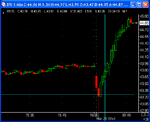
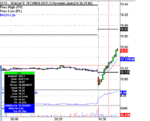
any comments for the below? tq

enter pega since new high
enter eni for swing trade
short el (but how come it keeps going up?)
 

Attachments

  • pega.png
    pega.png
    20.8 KB · Views: 233
  • eni.png
    eni.png
    22 KB · Views: 203
  • el1.png
    el1.png
    19.9 KB · Views: 201
Thank you, Richard, for sharing aspects of your method in a public forum.The principles you advocate, like acting on the evidence in front of your eyes instead of opinions, tight stops for controlling the risk and appropriate position sizing are golden, regardless of the system.

Speaking of risk, if I understand correctly, in your post #42 you suggest that we should use the "wrong" end of the previous candle as a stop to protect profits or minimize loss. That's, of course, for cases when Micro-Analysis (level2 buy/sell pressures T&S) doesn't prompt exiting even earlier.

Yet, in the same post you mention that you use candles in different timeframes, 1 min, 3 min and 5 min. That's also evident from the charts you posted thus far, and re-emphasised in your post #70. Would you mind sharing with us how do you decide on which timeframe to use ? Common sense would dictate that the shorter the timeframe, the higher the chance to be stopped out due to the opposite end of the previous candle being taken out.
 
Well - this thread has taken some twists & turns in it's time...

Richard - seems there's some people on here want some pro-bono dental work. Perhaps leaving out the anaesthetic will keep the freebie hunters at bay.

Anyway - not sure about the rest of you - but I couldn't get going yesterday - very choppy for me. I don't think today will be much different with FOMC at 2pm. I'll more than likely sit it out. Richard - how did you get on ?

Hiya DT,
:LOL::LOL::LOL:

Sorry not to reply sooner but have been on holiday.
There have been some choppy days but you tend to get them in slowly up grinding markets; just fewer oppys, but still there; more patience required in my experience.
Best wishes to you DT,
from the "greedy" and "selfish" one :rolleyes:
 
PS The only reason I changed from dentistry to trading was to provide Gordon Brown with more tax revenue, but I now realise what a selfish and greedy person that makes me.
Still gonna trade though......:LOL:
 
Hello behapca,
You only joined t2w today and you've read the whole thread already........?
I'll answer when I've got a bit more time.
Richard
 
behapca,
The vast majority of my trades using the particular method on this thread use either 1 min or 3 min candles.
I have two simultaneous charts on a screen showing both 1 min and 3 min candles.
If the 1 minutes show a clean clear trend WITH the "wrong" end of a candle being taken out then I look at the 3 minutes. If they show a clean clear trend WITHOUT the "wrong" end of a candle being taken out then I look to trade the 3 minutes. This is easily done when the method is to enter an existing trend.
Richard
 
Thanks for the reply, Richard. Much appreciated.

Interesting approach, yet it makes sense. I think that pretty much clarifies the exits for this method, if one relies on charts only.

I wonder if you use a similar approach, by switching the timeframes, on entry. As you mentioned in your post #4, you define a trend by a sequence of candles that have lower highs, or higher lows. Of course, the shorter the timeframe, the higher the chance that the nice waterfall will be broken. When that happens, do you switch to a longer timeframe to see if it still looks good ?

Also, do you use micro-analisys on entries ? Your posts #24 and #67 mention reading the tape. If that's the case, based on your experience, would you be able to estimate how many setups you pass because although they look good on charts they don't look good on tape ?

The reason why I'm asking is that even with proper risk control and position sizing, there's still the danger of over-trading, like you correctly identified in your post #71. For example, the charts on your posts #136 and #140 show potential entry points, prior to your actual entry, which had they be taken, would have resulted in scalps or losses. I guess what I'm trying to determine is how big a difference your edge makes in this method.

I hope you don't mind my being so inquisitive. I'm at my second run through this thread and it gets even better than the first read. For a newbie like me it's fascinating info.
 
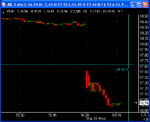
dri [email protected] exit 44.82, +1.1 Gis [email protected] exit 73.08 -.06 jbl [email protected] exit 17 +.06
jbl [email protected] exit 16.76 +.02

risk: 2%of account/ stop amount +2tick

Unlike mr chart. I feel safe to place a hard stop when I enter the trade. they dont get triggered often but I feel protected for unexpacted events(power out, computer freeze, etc)and plus order for me to develope a solid trading dicipline, first I need know that my system works. Untill I can fully believe in it, Im planning to use hard stops.

I did not take mr charts course but trying to formulate what I have learn into my own strategy, but he helped me with good ideas and gave me guidelines.

thanks. will report back with more result.
 

Attachments

  • fgpmarketplayer26.png
    fgpmarketplayer26.png
    12.6 KB · Views: 176
  • fgpmarketplayer27.png
    fgpmarketplayer27.png
    13.2 KB · Views: 209
  • fgpmarketplayer28.png
    fgpmarketplayer28.png
    10.8 KB · Views: 162
  • ScreenHunter_01 Mar. 24 09.52.gif
    ScreenHunter_01 Mar. 24 09.52.gif
    65.7 KB · Views: 201
bhapca,
I stay with the time frame I enter on.
I do prefer a level 2 T&S reason for the entry, but as I've said it isn't always there. What proportion? I've never analysed that so I can't say.
I don't over-trade.
As I've said, this particular method on this thread is only one of a dozen I use. I've also said this isn't about optimal entries, it's about taking bites out of trends with minimum risk.
I often find stocks through scanning and they are already in established trends, so it's no use looking back and thinking there was a better entry earlier, whether the result would have been a small loss, a small gain or a substantial gain.
You don't sound like a newbie to me. If you are, then I suspect on the basis of your questions you could have a good future in trading :)
Richard
 
As I've said many times before, I don't normally read anonymous PMs, although if I know the person then I do. Anyone with a sensible question can email me.
When I say sensible, I don't mean, "you is making trading so you say me now how I make the money with this betting" :LOL:
 
Soz about dat!!
Just wanted to make the money like you iz......

And no, you can't have my bank details so you can transfer 300 million Nigerian naira from your esteemed deceased uncle's Special Retention Fund from when he was Minister of Oil Supplies Procurement.
 
I'm going to expand a little from this basic method and show how I use some aspects of it in other ways.
I have to go off now to do a live session with someone but will explain a bit more in the coming days.
I have a huge number of charts illustrating trades I've taken so in the meantime, here's a trade from those archives.
It's an evening trade taken just after 8 pm UK time (3pm Eastern).
Richard
 

Attachments

  • 100310HLX.GIF
    100310HLX.GIF
    23.6 KB · Views: 268
I'll elaborate on the HLX trade if I can get a few minutes tomorrow morning.

Here's STX from this afternoon - a bread and butter sort of trade jumping on the trend after a retracement.
+27c for a 6c risk.
My attitude is to let the profits look after themselves and concentrate on the risk.
The risk you can control, the reward you can't.
Huge volume on the stock so you could buy as many as you wanted.

Richard
 

Attachments

  • 310310STX.GIF
    310310STX.GIF
    18.2 KB · Views: 267
I meant to have said the exit was because there was sudden strong selling on level 2 T&S, so I didn't wait for the usual chart signal to exit. If I had waited then I would have been stopped out for +17c rather than the +27c I got. The price fell further and the high you can see on the chart has proved to be the high of the day thus far.
Richard

thanks for the input. good trade indeed.
How did you scan this stock? I caouldnt find any breaking news on stx. It didnt have unusual volume at open and didnt drop that much on gap down. just curous about your criteria to find this stock and put it onto ur watch list.
 
Top