Best Thread How To Make Money Trading The Markets.

Thanks Amit.
I respectfully disagree with your comments about the first half hour.
I've just grabbed 31c RIMM using a method a bit similar to the one you use.
Have a good weekend in beautiful Ontario, Amit
Richard

PS And there are frequently very good trades in the final two and a half hours of the market (1830 to 2100 UK time).
 
I agree, but I was just stipulating that due to the volatility present in the first half hour of the market open, there are relatively more profitable trades available than at other times. I personally do not trade the first half hour and stick to trading only after 10am. I made one exception to a trade I took using your method, and it worked quite well!

Not trading right now, but may put on a trade or two in the last hour of the market.

Good trading,

Amit

P.S. You have email! 🙂
 
I do trade the first half hour myself as there are good opportunities, but you have to be aware of several things.
I've replied to your email with some suggestions.
Best wishes,
Richard


PS "I made one exception to a trade I took using your method, and it worked quite well!"

Excellent 🙂 🙂
 
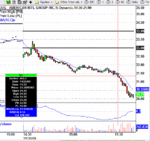
Here's one from today using this method.
Earlier I traded a different set up on AIG and got +14c on half the position and +2c on the other half, but kept AIG on the radar in case another one of my set ups occurred.
The one in this thread happened and this was the trade; red cross hairs on the entry and image taken at exit.
I didn't wait for the normal chart exit signal as it was clearly becoming unstable and threatened to go in the wrong direction.
+$1.10 per share

I'll elaborate when time permits.
Richard
 

Attachments

  • 301109AIG.GIF
    301109AIG.GIF
    22.8 KB · Views: 268
In the new year I'll post explaining how the underlying principles of this method can be used in a different situation to a one directional trend.
Richard
 
Richard, I have found this thread very helpful in exploring shorter term trading, so thank you. I've set up an IB account, watched for a while and now made a few small trades. Being unfamiliar with US markets, IB and eSignal makes transactions slow for me to execute and prices can move past my limits. May I ask how you do this, whether you use entry/exit limits, accept market prices...
Thanks, David.
 
Hi David T,
Executions using the combination of IB and eSignal are instantaneous 95%+ of the time and those that aren't only have a delay of a second or two.
As this is a little "off thread" you are welcome to email me (click on my name top left of this post and click on "send email") describing your problem and I'll try and help.
Richard
 
Hello all

Newbie here and found this thread very interesting. Thanks Mr. Charts and other contributing. I am trying to consolidate Mr. Charts tips..
a) From what I have seen, Mr. C chooses stocks trending. A trend is one making higher highs and lower lows (for short)
b) He says entry on X Red hairs..Can anyone please explain what it means ? Does it mean a red candle with a small wick ?


Thanks!
SG
 
Hi SG,
This thread is about just one of the methods I use.
When you look at one of the charts I've posted, the red cross hairs show where I entered the trade.
The image is always taken at the time of exit.
All that is explained earlier in the thread.

"A trend is one making higher highs and lower lows (for short)"

No. that is wrong.

A downtrend is when there are lower highs and lower lows.
An uptrend is when there are higher highs and higher lows.
Even then, those are very loose definitions, though they are the ones most people find easy to follow.

You need to learn some basics. Have a look at the First Steps forum here on t2w.
If you find that confusing email me (click on my name at the top left of this post, then on "email") and I'll send you a link to a site where you can learn the basics.

Hope that helps,
Richard
 
If you watch the chart closely there is red + cross line, thats like a cursor on a esignal chartl that is the point that Mr. Charts is entering the trade, Hope i clarified.

Hello all

Newbie here and found this thread very interesting. Thanks Mr. Charts and other contributing. I am trying to consolidate Mr. Charts tips..
a) From what I have seen, Mr. C chooses stocks trending. A trend is one making higher highs and lower lows (for short)
b) He says entry on X Red hairs..Can anyone please explain what it means ? Does it mean a red candle with a small wick ?


Thanks!
SG
 
Some very nice opportunities trading tonight with the late sell off.
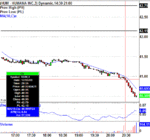
Here's one using this method.
+41c in a few minutes
That's $820 for 2000 shares, $410 for 1000, $205 for 500 and so on.
And what was the risk? Look at the ATR, look at the top of the candle; check out my previous comments on this thread about risk.
A 4c risk
And what was the probability of success?
That you can only make an intelligent guess at.......but a weak stock falling when the overall market is suddenly selling off.........that's a high probability trade in anyone's view !
When I used to do a day job I started out trading in the evenings only and built things up till I gave up my profession to trade like this.
I always think I did it, why don't others. Go for the high probability trades only and don't trade for the sake of it; be very self-disciplined and methodical.
Richard
 

Attachments

  • 031209HUM.GIF
    031209HUM.GIF
    17.1 KB · Views: 269
Thanks Richard! Sending an email as well..
srganesh - Yes. I now get it.

Hi SG,
This thread is about just one of the methods I use.
When you look at one of the charts I've posted, the red cross hairs show where I entered the trade.
The image is always taken at the time of exit.
All that is explained earlier in the thread.

"A trend is one making higher highs and lower lows (for short)"

No. that is wrong.

A downtrend is when there are lower highs and lower lows.
An uptrend is when there are higher highs and higher lows.
Even then, those are very loose definitions, though they are the ones most people find easy to follow.

You need to learn some basics. Have a look at the First Steps forum here on t2w.
If you find that confusing email me (click on my name at the top left of this post, then on "email") and I'll send you a link to a site where you can learn the basics.

Hope that helps,
Richard
 
Two more just using this one method.
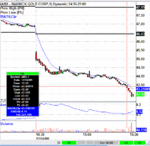
ABX
+45c per share
 

Attachments

  • 041209ABX.GIF
    041209ABX.GIF
    21.9 KB · Views: 255
and another
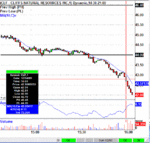
CLF
+80c per share

This isn't rocket science..........just read the thread thoroughly and then test the method for yourself on strongly trending stocks over maybe 100 paper trades and then decide if it's for you. Remember strongly trending stocks only and concentrate on sticking rigidly to the stop loss suggestions I've made and follow the exit rule of the opposite end of the candle being broken when in profit. You don't even have to understand level 2 T&S for this. Of course if you do, then you'll do even better.
Richard
 

Attachments

  • 041209CLF.GIF
    041209CLF.GIF
    21.8 KB · Views: 272
Thanks for the links..You make it look so simple !! One question which I hope you could answer
>>>>>exit rule of the opposite end of the candle being broken when in profit
Can you explain this ?

Thanks
SG
 
SG,
Before I answer that question, may I ask if you have read the whole thread?
Richard
 
Richard

Yes. I did...but I won't claim I have understood everything. I think I have a good idea on your entries...But not sure on your exits (particularly when it may go against you or how you lock your profits.) I also understand you won't be able to tell everything..But will appreciate as much as you can provide.


Thanks
SG
 
OK SG,
Look the chart of CLF taken at the time of exit.
If you have no level 2 T&S skills (or as sometimes happens level 2 T&S are either unreadable or simply noise) you would look at the top of that candle as being the potential exit. That candle high was 42.13, so you would exit at 42.14 to give you a 66c profit.
Now my reading of level 2 T&S (which I call micro-analysis) warned me that an unstable move or reversal was probably imminent so I exited. Most people looking at the chart would think I was stupid exiting there as the candles looked as if they had further to fall, but I had the micro-analysis skills to tell me a change in direction was increasingly likely. To put it another way I could see the three dimensional picture (rather than two dimensional charts) so I covered my short. That gave me +80c rather than +66c.
You see what I mean, you can trade very well without micro-analysis, but sometimes it will give you a clear and consistent and strong edge.
In fact what actually happened afterwards on the very next 1 min candle was severe instability with a low of 41.85 and a high of 42.25. I was able to see that instability coming so I got out.
Hope that helps you understand my chart exit strategy. It's a quarter past midnight here and I'm off.
Richard
 
One last point about micro-analysis.
Many people look at level2 T&S and because they themselves simply don't understand it they think that must somehow mean it's useless...........not a very logical or sensible approach, is it?
Usually they are looking at stocks where the volatility and speed is so great level 2 tells you very little. Also they think that because players fake and spoof the whole thing is somehow "no good". When you understand the games played and the interaction of buy and sell pressures and the consequent results you gain a considerable edge. Also they think all you have to do is follow the axe -that's nonsense; sometimes that is useful but much less so than even a couple of years ago.
Enough.
Richard
 
Back
Top