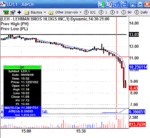
Best Thread How To Make Money Trading The Markets.

One other thought - I don't regard ATR or intra bar volatility as necessarily being "noise".
Price has moved - that's it. Don't label it as something because you feel a need to label or even explain. The price moved. Why does that have to be "noise"? Don't get tied up by indicators and labels. Just see what is happening and be open minded.

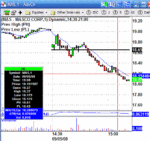
I mentioned a "failed" trade from Friday.
In this instance Micro-Analysis didn't help, it showed nothing significant and I exited as per the rule I mentioned earlier in this thread.
It was still a profit of 10c, even though it didn't follow through.
This is it.
Entry on the X hairs as always, exit at time of screen shot

Richard
 

Attachments

  • 050908MAS.GIF
    050908MAS.GIF
    23.7 KB · Views: 1,216
I think it's worth checking through the earlier charts so you can see the similarities between all of them. That will help anyone who wishes to recognise the pattern; visual repetition is worth many words.
Richard
 
This pattern cropped up many times this afternoon and I'll post the relevant chart of my HUN trade tomorrow or Wednesday. It's a nice waterfall :)
I've been on here long enough the last couple of days. Maybe I should learn to touch type.
Richard
 
thanks mr charts for this thread, very good.

from what i can see you find stocks that are in a clear trend and the trend is well developed, you then seem to buy or sell on level 2 volume pressures. Can I ask what else does a stock have to do fundamentally to qualifiy for your shortlist on a particular trading day, if your perpred to ask of course.
 
jj,
I don't necessarily use level2 pressures, but do prefer the confirmation of it.
Without using "micro-analysis" at all you can still enter on the falling (short) or rising (long) candle.
I think I said earlier in the thread that I scan for stocks and read news stories to find potential stocks which might fulfil the conditions for one of the dozen set ups I use.
Richard
 
I'm a bit behind with answering emailed questions, but everyone will get a reply......
 
Mr. C,

Please forgive my relative ignorance as I am just beginning to educate myself in this stuff and it will be a while before I risk a single cent.

Other than the bailout from this past weekend and its effect, can you give some examples of something in the news and how it was predicted to, and did, affect a certain stock?

I've read about one set up that waits for a spike at open due to some news to run its course and then enter short as it slides back down toward open. Some of the theory behind this says that its the hogs who buy according to the news and that savvy traders sell the news (assuming its good) by shorting the slide back. What do you think?

Also, I have read that in most instances in order to short you have to do so on an uptick, but in your charts it seems clear you shorted on a downtick. Please set me straight if you would.

Finally, the setup outlined in this thread might be called scalping, no?

Thanks for the thread and the time involved. It is very informative and demystifying.

Hi,
There are news stories every day which can give rise to great trading opportunities like QCOM on Friday which gave me a 37c profit in the opening minutes.

"expect pressure on RFMD as a key supplier to NOK and also QCOM as derivative indication of handset market weakness".

I really must emphasise again, I don't trade the news as such. News sometimes alerts me to possible moves and I then wait and see if one of the set ups I use occurs. I do NOT think to myself something "should" go up so I'll buy it - NEVER.
A lot of people do and the vast majority fail.

Re- Your para #3
It's not as simple as that if you want to be consistently profitable.
I do have specific set ups for that opening situation which work extremely well, but I'm not prepared to discuss them openly on a BB. Sorry. I could say more but the mods will ban me if I do.

Uptick? Like most things in books and that people on BBs who don't trade for a living come out with, this is NOT true. There used to be an uptick rule some time ago and you will find out of date references to it all over the web, but even then there was no such rule on ARCA so it was never really a problem except occasionally on NYSE stocks before the ARCA merger. I'm afraid a lot of people base their views on bad or out of date information they pick up from the internet.

Scalping, no. You can't call a profit of $1.10 a share a "scalp".

Another thing worth emphasising, is that I also use the set up on this thread on 3 MINUTE and 5 MINUTE candle trades, not just 1 min trades.

In other words, you could call them "swing" trades.

Hope that helps,
Richard

PS Alberta is a beautiful state. We did a cross Canada journey from Atlantic to Pacific last year - wonderful :)
 
Also please don't assume that this set up is successful EVERY time, nothing is.
A high percentage yes, and as long as you keep the losing trades small you can do very well.
The serious problems are over trading, lack of self discipline and an inability to execute the trade when you should.
Richard
 
Thought you'd like to know I had a losing trade with this technique this afternoon and lost -9c
The first failed trade of this set up for a while.
It was followed by a winning trade using the same technique of +74c so I shouldn't complain.
Will post both charts when time permits......back to "work" :)
Richard
 
Got LEH with this technique for a rather juicy +$2.69 a share.
I'll post the chart when time permits.
You can trade "hot" momentum stocks PROVIDED YOU KNOW WHAT YOU ARE DOING and can read the bid/sell pressures and the T&S and are coldly efficient - no indicators - ignore any emotions you might be feeling - and for beginners, use a small position size. Otherwise don't touch the "hot" ones, stay safe and slow and easy.
I am NOT suggesting anyone trades that sort of LEH situation without being experienced.
Richard
 
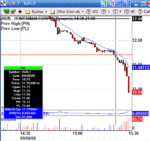
Yesterday I mentioned my trade in HUN in posts # 56 and # 65.
That trade was using this technique.
+76c per share profit
I exited as the momentum on micro-analysis appeared to die after a potential volume blow off. Also after a move like that I know from experience price can bounce up very fast and had I waited for the chart exit signal described earlier in the thread, it might have come at a much higher price thus reducing my profits.

Richard
 

Attachments

  • 080908HUN.GIF
    080908HUN.GIF
    21.3 KB · Views: 1,116
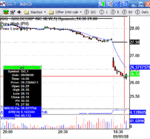
I used this technique three times this afternoon.
I'm going to post all three charts taken at the moment of exit.
With GG, micro-analysis on this occasion gave no advance clue to the reversal so I simply followed the exit rule described; just like the trade mentioned earlier which only gave me 10c profit.
This should make the exit clear in a losing trade simply using charts.
Richard

PS This was a 9 cent loss.
You must keep any losses small - that is absolutely vital
 

Attachments

  • 090908GG.GIF
    090908GG.GIF
    21.6 KB · Views: 942
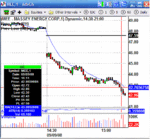
Here's the second trade.
Again note the set up pattern is always the same, easy to identify.
As usual X hairs on the entry, image at the time of exit.
In this instance micro-analysis raised the possibility of buying coming in so I exited.
+76c on this one.
The intra candle range was much larger with this stock - a higher ATR in effect - so this shouldn't be done without considerable experience or with a much smaller position size to allow for higher potential movement against the position.
Again, however, if you can read the buy/sell pressures and T&S the risk is much less than it initial appears visually or to those using indicators or mathematical formulae.
Richard
 

Attachments

  • 090908MEE.GIF
    090908MEE.GIF
    24.3 KB · Views: 1,027
Hi Mr Charts,
Sorry but I received no email from you, I even checked the junk mail...
Thank you anyway...

Hi nghislainf,
Glad you received the repeat email.
I received your follow up questions and have now answered them.
Let me know if you haven't received this morning's email.
Richard
 
This technique, as I said, works in most time frames, but you have to allow for greater intra candle range in your position sizing and risk control if you use charts only.
I'm keeping my eye on CRM and FAST over the next few days, just in case they set up.
Richard
 
This is the LEH trade I mentioned in post #73 on Tuesday.
Again the pattern is the same.
This move was for a very satisfactory $2.69 per share :)
Again X hairs on the entry and screenshot at the time of exit.
It looked like a potential volume blow off, so I was alert to that, although they can go on longer than you think and in any case this is about trading what you see.
Although it's not visible on the chart, the buys and sells became erratic and wide ranging on the bid and ask sides and sometimes that increased instability indicates a posssible imminent reversal. Time to take profits whilst they are still there.
Richard
 

Attachments

  • 090908LEH.GIF
    090908LEH.GIF
    22.8 KB · Views: 771
I don't mind questions via EMAIL, which does seem to cut out some of the silly ones sent via PM (which I will no longer read).
This sort of thing,
"is charting/technical analysis different from proprietary trading?"
What can I say?
Richard
 
I don't mind questions via EMAIL, which does seem to cut out some of the silly ones sent via PM (which I will no longer read).
This sort of thing,
"is charting/technical analysis different from proprietary trading?"
What can I say?
Richard

Lol !

Sounds like a case for him:

8656~Too-Screwed-Up-Posters.jpg
 
I don't mind questions via EMAIL, which does seem to cut out some of the silly ones sent via PM (which I will no longer read).
This sort of thing,
"is charting/technical analysis different from proprietary trading?"
What can I say?
Richard

Richard,

For all your dozen set-up's, who many candidates do you generate from the day before?

How many do you subsequently track in real time during that day (ie what % are discounted by news or opening price action).

How do you susequently track these during the day - do you follow each candidate visually or have you further screens programmed into your software?

How many hours of each trading day do you follow the market - do you follow the mid day lull?

Thanks in advance,
UTB
 
Top