Best Thread How To Make Money Trading The Markets.

Cryoplasm,
Whole numbers often act as support and resistance levels. See attached an example from this afternoon, 54.00 acting as a clear resistance level.
BTW I don't use technical indicators, they are normally based on the price, if the price moves up/down so do they, I think you can just use the price itself (just my humble opinion).
I use price (direction), volume (strength) and ATR (as a measure of volatility).

Without parading off-topic too much on this discussion..

Now, your argument is completely unconvincing :!: From your example, S/R could well have been 53.99 or 54.01 (real nos). The fact it was 54.00 (integer) is purely coincidental. One could derive additional regions of S/R in previous timeframes at which price points are not integers but real numbers. Integers are real numbers but not all real numbers are integers.
Cryoplasm

It's a psychological thing - not amongst those who are more conversant with trading, but with the general naive public.

When they are thinking about buying or selling equities, particularly as investments rather than trading, they don't normally say to themselves "I will buy when it falls to 53.99 because it is cheap". They normally think in integers or major decimal places such as .25, .5, so their internal message becomes "I will buy at 54 because it is cheap".

Thus there tends to be a preponderance of trades and stops set around these areas, of which the more canny trader can take advantage.

Charlton
 
Thanks for that excellent post, Charlton. It's saved me some time.
I would add that shops often sell products priced at £59.99 for example...........

shopsmart,
cryoplasm is correct about not needing 30 charts.
Put your watch list in a quote box and scroll down.
I also have the best six or eight charts on another monitor.
Richard
 
Four trades of this particular set up this afternoon.
EAT -7c
IBN -1c
WYN +102c
MEE +50c

I didn't take images of the two losing trades at the time of exit, but I did with the two winning trades and will post them.
I'll also explain two of the main ways I use stop losses and how to calculate them. The other way is using level 2 which is beyond the scope of this thread.
Richard
 
The two non-level2 methods for stop loss and position sizing:
First:
Opposite end of candle is stop loss on entry.
This means that if you are using 3 min candles and the opposite end of the candle is 13c away then 13c is the maximum loss to take on the trade.

Second:
ATR on time frame used.
This means that if you are using 3 min candles and the ATR is 10 on the 3 min candles then 10c is the maximum loss to take on the trade.

Position sizing to follow....
 
I always think in terms of maximum loss on a trade, and almost never focus on profit (reward) unless I am thinking of going long and resistance is nearby or thinking of going short and support is nearby. Those are situations which beginners should avoid for the obvious reason that price might reverse at support or resistance. I do scalp in such situations to catch bears in bear traps and bulls in bull traps but again that is beyond the scope of this thread and again not suitable for beginners.
Richard
 
So to position sizing.

Let's say you are prepared to take a maximum loss of $200 on a particular trade. Obviously adjust for whatever your personal maximum acceptable loss is, e.g. $500, $100, $50, whatever.

I'll use that figure of $200 to illustrate those four trades of this set up this afternoon.
 
I must emphasise I'm talking about MAXIMUM loss here.
I do NOT mean that I stay in a trade till a stop loss is actually hit.

These comments will be spread over quite a few posts as I am still watching the market looking for opportunities so might need to break off.
 
The first two will be my losing trades and the last two will be illustrated by the images I grabbed at the time of exit.

IBN at the time of the trade had an ATR of 10 and the opposite end of the candle was 13c away.
If you consider a maximum loss of $200 then 1500 shares was the right number (I personally don't mess with odd numbers of shares).
Had I been stopped out for a loss of 13c that would have been a loss of $195.
The rule of exiting the trade when it has moved into profit and moved on to the following 3 min time frame means that the stop loss has then become a trailing stop, again at the opposite end of the candle - as discussed earlier in the thread.
In the case of IBN that resulted in a loss of 1c, i.e. a $15 loss on that 1500 share position.
T.B.C.
 
The other loser was EAT
ATR 9
Opposite end of candle 10c away.
If your chosen MAXIMUM risk is $200 then that is 2000 shares
That trade failed and seeing it reversing I exited before the 10c MAXIMUM, losing 7c so for someone trading 2000 shares that would be $140.
For someone trading 200 shares that would have been $14 and pro rata.
 
Now for the two winning trades with charts.
WYN was a profit of 102c and MEE a profit of 50c
Descriptions and charts to follow when I've got a bit more time.
Richard
 
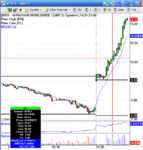
WYN was on 1 minute candles.
Entry on red X hairs, image taken at time of exit.
Exit was due to level 2 appearance.
Note how the low of every candle is higher than the low of previous candle.
+$1.02 per share
Richard
 

Attachments

  • 290409WYN.GIF
    290409WYN.GIF
    28.1 KB · Views: 358
Risk assessment:
ATR 14
Low of candle 8c away
For those with a MAXIMUM loss tolerance of $200 per trade that's 1400 shares 14c x 1400=$196

Risk known.
Reward unknown but as it happens in this example $1428.

Control risk in strongly trending stocks and let profits run with the chart exit rules as described earlier in the thread - even without the added benefit of level 2.
Will post MEE trade when time.
Richard
 
Mr. Charts - I've sent you an email but because on my enthusiasm i'll also post here just in case i get a quicker answer...

What criteria do you use to scan for these stocks and at what time?
I have esignal and the scanners (Premarket scan, Power Scan, Rally scan)

I was wondering which you use, with what settings and at what time... Thanks Mr.C
 
HaloTrader,
I replied to your email on Thursday evening. I'll re-send in a few minutes. I assumed your message was in response to this thread:
http://www.trade2win.com/boards/gen...consistent-20-percent-profit-mo-possible.html

Richard

Hi , could u disclouse what settings u use for esignal scanners ? i tried them for a free trial and i found them normal and not very usefull , i use proscreener from IG charts , u can code it to search US stocks ( only stocks offered by IG ) using predefined criteria , for eample : u can search for stocks with a 10 EMA above 21 EMA above 50 SMA and with a 60+ RSI with stock price between lets say 30 - 60 $ . Do u have any suggesstions about which setting to use for this proscreener ? i can code it if u want it is easy .
 
richard fantastic thread, thanks very much for your time posting, has really opened my eyes to your style of trading,it fits my personality better than anything else i'v tried so far.

Tar,
i trust richard wont mind if i have a go answering your question, settings for scanners, are probably better worked out by you, so you understand how they work ect. but try looking at these ideas,
scan at the open for gaps ABOVE yesterdays high (see richards post #357 WYN) as example
secondly (i dont have esignal so not sure how to on it) look for "RALLYING now" type of scan and set it for 15/30 min if you have a retraced from high setting try less than 10%.
im new to this style but both of these have given me a fair few setups, altho im still working on it.
cheers Bry.
 
Back
Top