Best Thread How To Make Money Trading The Markets.

thank you very much for your replies, Mr Charts.

Regarding TXT, it came through on my news monitor shortly before the market opened, i put it on my watch list and traded it accordingly.
It is encouraging, for me, that I entered on exactly the same bar as yourself, even if I did not let all of it run as long as I should have done.
I know this thread is just for the one method, but, yes, I am a curious and interested to know how TXT came into your list?
thank-you once more for this most interesting thread.

notlob,
I'm sorry I didn't answer your question. I wasn't being rude, it just slipped through somehow.
I can't remember whether I saw it pre-market and didn't put it on my radar, though checking back on my news feed there was a pre-market story that day about committed bank credit lines. Looking back through the archive on my private site I alerted people to it at 2:41:35 pm UK time so I think I must have picked it up off my scanner as a substantial faller.
Hope that helps.
Richard
 
Hi Mr Charts, how important is the level 2 time and sales in intraday nasdaq strategies? The chart patterns are very good, but its just that I have tried looking at nasdaq level 2 and TS before and it seemed way too fast and difficult to see what was going on. Do you think it could be possible to trade the chart patterns only and make a profit? Thanks

alfiemal,
I'm not going to go into detail publicly about how I do this, but a lot of the time level 2 is just noise/insignificant. There are times when it is priceless because it tells you what is highly likely to happen BEFORE it does.
That becomes extremely difficult on very fast moving stocks, it becomes unreadable as you infer. However, on other stocks it is very readable at key points and that is when it is priceless for keeping you out of, just as an example, breakouts which then go on to fail. It's not infallible, but it gives me a huge edge.
Yes, it certainly is possible to trade the chart patterns only and make a profit, but the success rate won't be as high or the profits so substantial.
I view charts as being two dimensional; the third dimension is level 2 T&S; not always necessary, but sometimes a huge help.
Hope that helps,
Richard

PS In a sense it's about the speed of what is happening; sometimes it's too fast to read like a page in a book being turned every 5 seconds; with some stocks it's like having 50 seconds to read the page. I don't mean the screen remains unchanged for 50 seconds, I mean sometimes with some stocks you have the time to read what is going on. Don't assume all pages turn every 5 seconds just because you've looked at fast movers which do.
 
Thanks Mr Charts, I see what you mean, come to think of it the nasdaq stocks I was watching level 2 on were probably some of the larger unreadable stocks like Apple, Cisco etc companys that I knew the name of. I suppose with a little experience it would be easy enough to filter out some of the unreadable stocks with a scanner and concentrate on the slower higher probability trades!

Im interested in this method, as I would prefer high probability trades rather than what im used to fx, indices etc.. were its difficult to get any consistency!
 
Many thanks for your reply, Mr Charts, I certainly didn't think you were being rude, as I'm sure you have 101 other things to do other than posting here!

Thank you for your answer, appreciated.

I was also interested in your NVDA trade that you posted. I also had NVDA on my watch list, but took the view it was not trending strongly enough to enter into a trade. But given a bit of hindsight, I can see exactly what you mean and perhaps I should be a bit more open to those sort of opportunities in the future.
 
edit
I should just say that NVDA was trending, but the 1 min candles were not marching down in the most pleasing way of many of the trades you have posted on this thread.
 
See the opening comment post #257

I look at both 1 min and 3 min candles (and sometimes 5 min) and see opportunities for slower swing trades on 3 min which aren't there on the quicker 1 min.
Which is what you are saying :)
Richard
 
hello everybody, I am new here, and also very new to the world of forex, and advice from u will be valuable to me
 
Hi Richard, Just checked into T2W again and it's only natural I should find my way here to this thread.

As Richard says if you are sensible day trading the US markets is a great way to earn a living. I've been doing it since 1999 the same as Richard. At the moment I'm trading the SKF on a regualr basis.

All the best

Alan
 
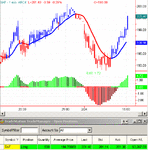
I like to look for good intra day swings and the SKF gives me that. Here you can see the divergence in the ocillator gave me the heads for the next swing move up.

The SKF can be quite volatile so FAZ is a good alternative.

skf4.gif
 
This particular set up occurs every day.
Here's one this afternoon.
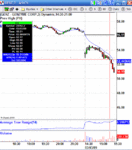
+$1.66 per share

The initial WORST CASE SCENARIO stop was the top of the entry candle, 36c away. If you are trading without the benefits of reading level 2 (the third dimension) and merely use charts (two dimensions) you simply adjust your position size to the greatest loss you are prepared to accept.
If you use level 2 then IF it is readable (and it isn't always) then use change of momentum in buy/sell pressures for a much tighter stop loss.
Richard

PS Red X hairs on point of entry, image grabbed at time of exit - as usual.
 

Attachments

  • 030309GENZ.GIF
    030309GENZ.GIF
    25.4 KB · Views: 387
This was a 3 min swing trade, rather than a scalp.
Why did I cover before the chart rule of the high of the previous candle being taken out?
Level 2 told me instability was coming in as the smoothness of the sell pressures became erratic and the buy pressures changed plus T&S demonstrated that potential instability was starting to actually happen.
This resulted in 52c more profit than if I'd waited for the chart signal to occur.
This is an image of what happened later.
Richard
 

Attachments

  • 030309GENZwhathappenedlater.GIF
    030309GENZwhathappenedlater.GIF
    6.8 KB · Views: 322
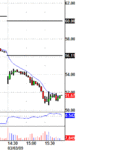
This set up doesn't always work, nothing does, so here is a loser from a few minutes ago.
Worst case stop loss at top of candle was 19.05, 17c away, but that is literally the worst case scenario.
When the momentum changed on me I exited the trade for a loss of 2c
Richard
 

Attachments

  • 030309HUM.GIF
    030309HUM.GIF
    28.9 KB · Views: 342
...and this is what happened next
 

Attachments

  • 030309HUMwhathappenednext.GIF
    030309HUMwhathappenednext.GIF
    8.9 KB · Views: 299
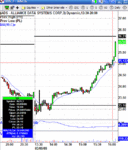
It's rare not to be able to find this particular set up !
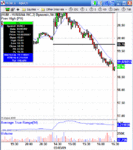
Entry on the red X hairs on break out and exited at time of screen shot because level 2 T&S warned me of possible instability ahead so I didn't wait for the usual chart exit signal.
Nice swing trade on 3 min candles
+89c per share

Richard
 

Attachments

  • 090309ADS.GIF
    090309ADS.GIF
    26.2 KB · Views: 369
In laymens terms i'd say it's a short term trend-continuation method.

If it's going down, then pauses then takes out the lows the trend is probably continuing.

I guess you could apply it to any time frame really if you find the smaller ones a little too low brow for your trading
 
Top