Re: Gbp/jpy120
Good question! I wish there were more quality questions like this one, because it would add to the thread.
I will say your assumption is wrong, in the possible assumption that I was going to whip out some probabilities as per previous posts. After sigma 3, it is redundant to say what the odds might be to get to 4 or 5. It's a possibility, but not practical. Therefore in looking at SD bands, the Hurst bands, etc, this is why they only contain 3.
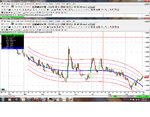
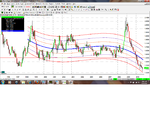
If there was a .05% chance of it getting to 4 or 5, I still don't like those odds, so in order to answer the question, I have posted a couple of charts--daily of the EUR/AUD and the monthly of the EUR/AUD. I know there is a lot of information in the nuggets to assimilate, but I did mention the fact that upon entering a position to be aware of the TF's around you and what they are doing. The daily chart is showing how price blasted off to the +5 sigma. This was the beginning of May. The monthly chart is showing price action being contanied at -3. albeit, with downard momentum. Very dangerous situation to enter a short, just because of the monthly chart.
What we do see on the monthly is no excpetion to the rule, and that is how the individual sigma levels act as great S&R levels Eg---2 after the rise.).
The price action as witnessed on the monthly chart in Oct 2008: That hit +6, and then a strong move in reverse that has been active since then. I cannot answer what happened here without conjecture, so here goes. I don't have a yearly chart, but if by applying the formula, I could venture a guess that something was going on on the yearly. The weekly is showing that it hit +3 the same time the monthly blew out, but it is unsafe to try and backtest a mathematical indicator that is dynamic (It's safe it backtest my S&R's, because they are stationary.).
I still have not ansswered your question that I will slightly reword, "What would I do in a situation like that?" First, and you'll just have to believe me here, it's my policy to never get in the way of a freight train. That move resembled just that. I also missed the move coming back. There was considerable clamor in the chat room we had (a different one after the one disbanded in March 2008.) about where to get in, etc. I simply stayed away, because it was out of control.
Let's say I did enter it. I would have done the same thing as I did in 2009 through more money at it (Got to have the bachup plan.). There is another option, and that is to hedge the trade. In other words, make lotosd of pips while it goes against you, and then take it out, then jump out of the long with a loss, but a net gain. Dangerous? You better believe it is. This why I don't like freight trains.
One very interesting point about the move in Oct. 2008 I'd like to point out is that the circa area it peaked was my decade's R2. This does exaplin, in part, the powerful reversal. It was a measure of, once again, the tremd's range, but on the level of the deacde.
My decade's levels for 2010--2019 are available, upon request.
4x, what if say it continued to +4 then +5 sigma, at what point would you close it? and don't say the odds of +5 sigma etc.. I know my maths! if the environment has changed such that the trend really has changed then it invalidates your sigma lines. At what point do you close it out for a loss? I think stating this would help round off your nuggetts nicely, as you do state you do close some off for losses, so what's the nuggett on when?
thanks


