WklyOptions
Well-known member
- Messages
- 269
- Likes
- 24
training eyes to "see" poor T1 setup
Hi, T2W traders,
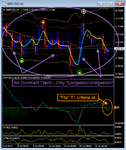
This is a quick post on the attached H4 chart on GBPUSD.
I posted this chart to help those traders that have downloaded the free ePDF "Tracking Big Money Trends" - and able to understand and apply the concepts of T1 and T3 rules/criteria for multiple time frame analysis.
OK - lesson on GBPUSD chart (H4 as the T1 chart):
1. At the right edge - it appears as if the H4 chart shows a bearish trend & momentum.
2. The H4-T1 chart showed MACD < 0, and MACD Fast Line sloping downwards, and the Fast Line < Slow Line.
So on a word-for-word basis, it appears that the H4 chart would have a qualified T1 bearish trading setup.
However - ALERT! :!:
Traders would do best to grasp the essential concept ---> the strategy is to find a Dominant Trend on the T1 chart - and then attack/exploit Pullbacks against that Dominant Trend.
If you zoom out of the H4 chart - you can clearly see there is NO DOMINANT TREND to the downside. If fact the GBPUSD is in a trading range on the H4 chart.
Understand?
The absence of a strongly trending bearish T1 chart pattern = NO DOMINANT TREND. :idea:
Especially important for new traders - it is often much easier to trade in strongly trending chart patterns - and to avoid chart patterns that are in "congestion" (or "indigestion" as many of my trading colleagues call it).
Learning to avoid weak/inappropriate trading setups (even if rules/criteria "ok") is an important skill-set for the profit-oriented highly focused/selective trader! 👍
Hope it helps some here. Please feel free to post your questions or chart setups.
Thank you.
WklyOptions


