You are using an out of date browser. It may not display this or other websites correctly.
You should upgrade or use an alternative browser.
You should upgrade or use an alternative browser.
Home-Based Trading Career Pathway & Journey...
- Thread starter WklyOptions
- Start date
- Watchers 8
EurCad
Good morning WO,
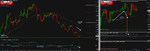
Here's my latest setup that I've seen happening. The setup occured while I was off in the land of nod. But price was hanging around the area, put in a double top on the hourly, so I put my pending order right where I would have had I seen the setup as it occured, and the stop at the point I would have. So I'll now let it play out to conclusion.
I believe I'm seeing with different eyes now.
Thank you for the smack to the head and clearcut explanation. Sometimes we can't see the forest thru the trees, or is it the other way around...anyway a heart felt thank you.
K.C.
Good morning WO,
Here's my latest setup that I've seen happening. The setup occured while I was off in the land of nod. But price was hanging around the area, put in a double top on the hourly, so I put my pending order right where I would have had I seen the setup as it occured, and the stop at the point I would have. So I'll now let it play out to conclusion.
I believe I'm seeing with different eyes now.
Thank you for the smack to the head and clearcut explanation. Sometimes we can't see the forest thru the trees, or is it the other way around...anyway a heart felt thank you.
K.C.
Attachments
WklyOptions
Well-known member
- Messages
- 269
- Likes
- 24
Good morning WO,
Here's my latest setup that I've seen happening. The setup occured while I was off in the land of nod. But price was hanging around the area, put in a double top on the hourly, so I put my pending order right where I would have had I seen the setup as it occured, and the stop at the point I would have. So I'll now let it play out to conclusion.
I believe I'm seeing with different eyes now.
Thank you for the smack to the head and clearcut explanation. Sometimes we can't see the forest thru the trees, or is it the other way around...anyway a heart felt thank you.
K.C.
Hi, KC,
Well, looks like the H1 setup on the EURCAD is correct - esp after the H1 double top formation. For betting on T1 and T3 (and not using any additional T2 criteria), may I suggest a more conservative betting scheme?
1. Always be prepared to at least have 2-3 "bullets" per T1 trading setup - as long as the T1 criteria remains intact.
2. Upon entry off any H1 criteria - look to exit 50% at (+1R). Keep remaining 50% at original Stop-Loss point.
3. Then if trade is profitable - let remaining 50% position run to at least (+3R) or greater - and begin to look for exit points.
This conservative scheme will be less profitable than the alternate one I like to use (exit 50% at +2R). However, by exiting 50% at (+1R), it allows u to at least minimize 1st-trade "traps" to some degree.
Well, let's see how the EURCAD trade unfolds now...
Thx.
WklyOptions
Hi, KC,
2. Upon entry off any H1 criteria - look to exit 50% at (+1R). Keep remaining 50% at original Stop-Loss point.
3. Then if trade is profitable - let remaining 50% position run to at least (+3R) or greater - and begin to look for exit points.
Hi WO,
Following your advice, I exited half the position at +1R, and the remainder was exited at +3R, for a combined profit of +2R total.
2nd pic is from en entry last night, wasn't able to capture and post the picture last night. Daily is showing more momentum from the candles, larger moves down than up.
-T1 MACD FL < 0, check.
-T1 MACD FL< SL
-T1 MACD slopes, down, check
-T1 move pullback against trend (candle close), check
-T3 MACD > 0, orderly pullback, check
-T3 MACD FL turn down, resumption of dominant down trend, check
KC
Attachments
Last edited:
WklyOptions
Well-known member
- Messages
- 269
- Likes
- 24
Hi WO,
Following your advice, I exited half the position at +1R, and the remainder was exited at +3R, for a combined profit of +2R total.
KC
Hi, KC,
Nice work! As you can see, if on avg, for example:
1. Losing trades (-1R) - maybe try to minimize at 20% full loss.
2. Breakeven trades - perhaps some 35% of trades are scratched.
3. Winning trades (+2R) or better - perhaps 40% to 50% of trades winners
You will be trading with a strong positive EDGE.
KC - just remember - this T1/T3 is only at its most basic form. There are methods that can be positive edge multipliers including:
4. Learning to let 50% remaining open positions travel > (+3R) to strong areas of measured-move-objectives (MMOs), or strong T1 areas of Key Support/Resistance, etc.
5. Learning to use methods to scale in and scale out across various time frames, using the T2 and T3 charts to scale in/out accordingly in the T1 direction, etc.
6. Learning to move the Trailing Protective Stop (TPS) accordingly on the basis of T1 volatility and Key Support/Resistance, etc.
There are many tools to help capture > (+3R) on remaining open positions!
Golden Rules for newbies:
7. Study, study, study - explore new techniques - explore new technologies! :smart:
8. Don't be lazy - don't be sloppy - don't be careless. Don't be $$$ cheap on yourself! 👎
9. Push your Standards higher! :clap:
Trading is very fluid and effortless - but only if you lean in the direction of the Big Money trend & momentum.
Nice job, KC! Will look at your AUDCAD soon. 👍
Regards,
WklyOptions
WklyOptions
Well-known member
- Messages
- 269
- Likes
- 24
T2W members,
Quick learning chart attached.
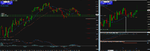
I have attached a chart of BAC - a US-listed equity/stock chart - that shows the exact same Big Money trend continuation setup on the Weekly time frame (right chart).
Lesson: every week there are many (in fact too many) excellent T1 trend continuation setups!
As trading is about making (and keeping) profits, a trader needs to maintain flexibility and awareness across all markets, in all time frames!
FX trading, options trading, intraday scalps, intraday binaries, etc. Really does not make too much of a difference.
If traders learn to identify, isolate, and wait for ideal low-risk Entry criteria - and enter into high momentum-biased T1 trends, the % chance to at least break-even or profit - will be in favor of that trader. :idea:
As T2W readers will see, my posts on options swing trades, weekly options trades, and fx trades, and binary options trades, will all look "similar" with regards to the T1 and lower time frame charts!
Best regards,
WklyOptions
Quick learning chart attached.
I have attached a chart of BAC - a US-listed equity/stock chart - that shows the exact same Big Money trend continuation setup on the Weekly time frame (right chart).
Lesson: every week there are many (in fact too many) excellent T1 trend continuation setups!
As trading is about making (and keeping) profits, a trader needs to maintain flexibility and awareness across all markets, in all time frames!
FX trading, options trading, intraday scalps, intraday binaries, etc. Really does not make too much of a difference.
If traders learn to identify, isolate, and wait for ideal low-risk Entry criteria - and enter into high momentum-biased T1 trends, the % chance to at least break-even or profit - will be in favor of that trader. :idea:
As T2W readers will see, my posts on options swing trades, weekly options trades, and fx trades, and binary options trades, will all look "similar" with regards to the T1 and lower time frame charts!
Best regards,
WklyOptions
Attachments
WklyOptions
Well-known member
- Messages
- 269
- Likes
- 24
Hi WO,
2nd pic is from en entry last night, wasn't able to capture and post the picture last night. Daily is showing more momentum from the candles, larger moves down than up.
-T1 MACD FL < 0, check.
-T1 MACD FL< SL
-T1 MACD slopes, down, check
-T1 move pullback against trend (candle close), check
-T3 MACD > 0, orderly pullback, check
-T3 MACD FL turn down, resumption of dominant down trend, check
KC
Hi, KC,
Okay, let me share a couple of fine-tuning for this AUDCAD setup example:
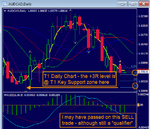
1. The T1 Daily criteria "fits" the rules - however, if you look at the price action on T1, the AUDCAD chart on T1 does not "jump out BEARISH" in its price action at least to my eyes. The T1 Daily price action is in a wide trading range - and - it is about to hit T1 Key Support at the 1.00250 zone. (see attached 2nd chart)
2. The T1 criteria is just "ok" - trade-"able" - but I may have passed on this setup.
Now - if we had decided to Enter a bearish T3 setup, then your T3 checklist would have been a good "go with it" checklist.
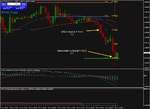
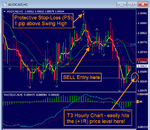
3. In the attached T3 Hourly chart - I had setup a Protective Stop-Loss (PS) at 1 pip above the T3 Hourly Swing High @ 1.00942. The SELL entry would be 1 pip below the T3 3rd red bar down @ 1.00747.
If you see the attached T3 Hourly chart - you can see clearly that it hit (+1R). If 50% of the bet-size position is exited at (+1R), and the remaining 50% kept at the PS swing point - at the very least - we will have a "free trade". A chance at hitting (+3R) or better on the remaining 50% open position.
Just be alert to the projection of the (+3R) region - is right at the T1 Daily point of Key Support (see 2nd attached T1 Daily chart).
Again, relating back to items (1), (2) above - I may have passed on this trade b/c usually I like to have T3 Entries and T3 high (+R) Targets > (+3R) into the T1 main Dominant Trend. I prefer to have my (+3R, +4R, +5R...) into new "open water" territory on the T1 charts. :idea:
Understand? Questions?
Well, worst case scenario - scratch trade. 👍
Very good eyes - I can clearly state that you are truly developing a professional trading SKILL - the ability to "see" low-risk setups into Dominant Trend T1s! :clap:
Keep it up - keep training your eyes! Keep "hunting" for good setups. It is already becoming a winning habit for you!
Thx for your charts and input!
WklyOptions
Attachments
WklyOptions
Well-known member
- Messages
- 269
- Likes
- 24
T2W members,
I've received several PMs - asking questions related to trading journals, etc. Unfortunately, in the T2W threads, there are many so-called trading journals that are really not much more than just a "trade blotter".
A true trading journal is designed to assist and actively engage, actively push forward, the professional trader to grow, be challenged, etc.
For example, if a trader is "comfortable" making $250 per trade - then the trading journals should actively push the trader to grow to $500 per trade (or higher). If a trader is "comfortable" trading 1 per month in stocks, then perhaps the trading journal should actively push the trader to find 5 trades per month - in stocks, forex, options, etc.
The major point = a professional trader must enjoy and have internal excitement over being challenged and producing excellent trading results consistently!
One quick point - there is a fine line between "excitement" vs "stress/fear/anxiety" in terms of mental, emotional, and physiologic metrics. The trading journals hopefully will help train, rehearse, condition, and prepare the pro trader to develop "enjoyment & excitement" >> "fear/anxiety/stress".
I am not certain if/where it may already be available here in T2W - perhaps Tim can help. I've attached two PDF files on trading journals that provide very good information and actionable trading journal-related recommendations.
In my experience, I've found it best to really maintain two different "books":
1. Professional Trader's Log Book - similar to a professional log book, it contains the mental, emotional states, the thinking states, the energy and health levels, etc. This Log Book deals with the professional trader directly and intimately. It provides actionable areas for personal/professional development, growth.
2. Professional Trader's Debriefing Log Book - this DLB is specifically focused and related to the technical trading actions and results by the professional trader. It deals in areas of plan deviations, unexpected scenarios/developments, wins/loss analyses, trader error metrics, Lessons Learned objectives from specific trade-related items like chart analysis, betting/money mgmt analytics, Profit-taking rules, etc.
The idea is to split the top-performer metrics from the performance metrics.
It may be a bit confusing - but I will share and provide many examples in these areas soon.
No matter how you prefer to document and record and measure your trading performance, it must be done accurately, promptly, and daily! It must be trained, conditioned, rehearsed - and "moved" into a Standard and habit (Conduct) for trading excellence. No exceptions, no excuses, no delays. 👍
For now, I hope you can find some benefit and applicable and actionable items from the two enclosed PDFs.
Best regards,
WklyOptions
Attachments
Good morning WO, other T2W members,
This week the wife and I are on vacation so I'm unplugging from trading and online activity while we rest, relax, and reflect, and hopefully welcome our first grandson to the world.
So here's an update on my current running trade, AudCad, target 1 hit, stop still at original 1R risk, and target 2 @ 3R, so it will either end at overall +2R or breakeven. As WO said earlier it should make no difference what the outcome is on a per trade basis. Look at a block of 20 or 30 trades , diagnose what areas could use improvement of changes and trade the next block. Paradigm shift... rinse repeat.
So with that I wish everyone a good trading week should you endeavor to trade, an for those celebrating Independence Day this week have a wonderfully 4th and extended week and see ya'all next week.
KC
Last edited:
WklyOptions
Well-known member
- Messages
- 269
- Likes
- 24
Good morning WO, other T2W members,
This week the wife and I are on vacation so I'm unplugging from trading and online activity while we rest, relax, and reflect, and hopefully welcome our first grandson to the world.
So here's an update on my current running trade, AudCad, target 1 hit, stop still at original 1R risk, and target 2 @ 3R, so it will either end at overall +2R or breakeven. As SO said earlier it should make no difference what the outcome is on a per trade basis. Look at a block of 20 or 30 trades , diagnose what areas could use improvement of changes and trade the next block. Paradigm shift... rinse repeat.
So with that I wish everyone a good trading week should you endeavor to trade, an for those celebrating Independence Day this week have a wonderfully 4th and extended week and see ya'all next week.
KC
Hi, KC,
Great trade mgmt! Trading becomes very simple and clear and enjoyable - when you know what and when "to do" across your trading scenarios!
Have a great July 4th holiday wknd w the Mrs! 👍
Best regards,
WklyOptions
I'm Baaaaaaaaack
🙂 ..... just couldn't resist
Good evening WO and other T2W members,
Back from a wonderful week off. Was browsing through the charts and seen this little gem setting up on CadJpy.
-T1 MACD FL > 0, check.
-T1 MACD FL > SL
-T1 MACD slopes, up, check
-T1 move pullback against trend (candle close), check
-T3 MACD < 0, orderly pullback, check
-T3 MACD FL turn up, resumption of dominant up trend, check
Seems as tho the thread has been very quiet since I've been away. I'll refrain from posting the other 3 pairs that I see starting to show potential setups.
KC
EDIT: Order cancelled, T3 MACD turned back down.
Attachments
Last edited:
EurUsd
Hello T2W traders
Here's my latest endeavor
DOWN TREND
-T1 MACD FL < 0, check.
-T1 MACD FL < SL
-T1 MACD slopes, down, check
-T3 MACD > 0, orderly pullback, check
-T3 MACD FL turn down, resumption of dominant down trend, check
Profit target 1 at 1:1 1.3589, target 2 is down at 1.3509 at 4:1, leaving stop at original position after target 1.
Will wait and see how this one pans out.
Did I miss anything?
KC
Attachments
WklyOptions
Well-known member
- Messages
- 269
- Likes
- 24
Hello T2W traders
Here's my latest endeavor
DOWN TREND
-T1 MACD FL < 0, check.
-T1 MACD FL < SL
-T1 MACD slopes, down, check
.....
Did I miss anything?
KC
Hi, KC,
Thx for posting this trading setup - very good Learning Objective scenario. 👍
It's also an important reason for T2W members to become active and submit their trading observations and ideas - so that all its members can learn and grow to take only the very best low-risk/high profit potential trading setups! :clap:
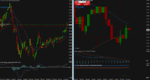
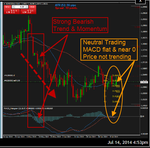
Ok, just a couple of quick but important items to help fine tune your eyes on the Trend Continuation setups - for this Learning Objective, only need to focus on the T1 Daily chart of the EURUSD (please see attached chart):
1. Price action on T1 Daily = EURUSD is in a range bound zone of the price chart. In a Down Trend - we want to see new lows and lower highs immediately on the "right edge" of the T1 chart.
2. The T1 Daily MACD = hovering about the zero line for several days/bars. Flat MACD lines mean there is no major bias, no major buying/selling pressure.
3. The T1 Daily MACD Fast & Slow Lines = horizontal and adjoined to each other = zero momentum.
However, if you look to the left side of the attached T1 Daily chart - you can clearly see where the T1 price action had a strong move to the Down side:
4. T1 Daily with new lows - taking out past T1 support pivots.
5. T1 Daily price action with lower lows, lower highs, wide range Down bar, etc.
6. T1 MACD < 0 on consecutive bars.
7. T1 MACD Fast Line slope sharply pointing Down.
8. T1 MACD Fast Line below Slow Line - and gap between FL and SL widening.
The items (4) thru (8) help to focus and identify strongly bearish trend and momentum - via its price action and MACD "visuals".
This is where the professional trader can learn, rehearse, visualize, condition - his/her eyes to "see" what strong trend and momentum is being signaled on T1.
Remember - we need to "see" strong bearish evidence in both trend and momentum on the T1. Also remember, T1 represents the "institutional order flow or footprints". Large trend and momentum moves by large traders CANNOT be "hidden" in the T1 charts (esp the Daily, Wkly, or Monthly T1 setups).
Hope this helps some. As always, great work and input from KC! So those of you T2W members who have read thru the free PDF e-book on Trend Continuation setups - please - don't be shy. Post your T1 and T3 chart setups here!
Share, observe, comment, learn, challenge, participate actively! You will get better quickly and consistently! :smart:
To make real $$$ in the markets trading - you need to sharpen your "trading blade" - and this is done by sharpening your focus and training your eyes to really "see" and select only the strongest trend and momentum setups. :idea:
KC - thx for your time and input! Keep bringing it to us at T2W!
Regards,
WklyOptions
Attachments
NzdCad
Thx WO,
Your insightful thinking and constructive analysis is always worth a few readings. Thank you for "honing" my soon to be exceptional edge for trading. If no one else cares to post that's ok by me, at least my skills will be honed better than theirs are, so maybe my pockets will be lined with the accounts of those who haven't honed them. 😆
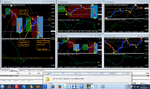
Here is the latest I see happening. This one addresses the issues of momentum better than the previous chart. The MA's are diverging (gap between increasing) showing momentum starting to increase, as well as the MACD FL and SL.
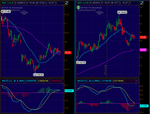
UP TREND
-T1 MACD FL > 0, check.
-T1 MACD FL > SL
-T1 MACD slopes, up, check
-T1 move pullback against trend (candle close), check
-T3 MACD < 0, orderly pullback, check
-T3 MACD FL turn up, resumption of dominant up trend, check
Doesn't seem like I've missed anything, but as always your expert opinion is greatly appreciated! I'm still adjusting mine eyes to see much better through the fog. 😉
KC
Thx WO,
Your insightful thinking and constructive analysis is always worth a few readings. Thank you for "honing" my soon to be exceptional edge for trading. If no one else cares to post that's ok by me, at least my skills will be honed better than theirs are, so maybe my pockets will be lined with the accounts of those who haven't honed them. 😆
Here is the latest I see happening. This one addresses the issues of momentum better than the previous chart. The MA's are diverging (gap between increasing) showing momentum starting to increase, as well as the MACD FL and SL.
UP TREND
-T1 MACD FL > 0, check.
-T1 MACD FL > SL
-T1 MACD slopes, up, check
-T1 move pullback against trend (candle close), check
-T3 MACD < 0, orderly pullback, check
-T3 MACD FL turn up, resumption of dominant up trend, check
Doesn't seem like I've missed anything, but as always your expert opinion is greatly appreciated! I'm still adjusting mine eyes to see much better through the fog. 😉
KC
Attachments
WklyOptions
Well-known member
- Messages
- 269
- Likes
- 24
Thx WO,
Here is the latest I see happening. This one addresses the issues of momentum better than the previous chart. The MA's are diverging (gap between increasing) showing momentum starting to increase, as well as the MACD FL and SL.
UP TREND
-T1 MACD FL > 0, check.
-T1 MACD FL > SL
-T1 MACD slopes, up, check
-T1 move pullback against trend (candle close), check
-T3 MACD < 0, orderly pullback, check
-T3 MACD FL turn up, resumption of dominant up trend, check
Doesn't seem like I've missed anything, but as always your expert opinion is greatly appreciated! I'm still adjusting mine eyes to see much better through the fog. 😉
KC
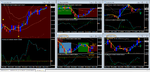
Hi, KC,
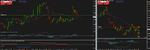
Yes, the T1 and T3 criteria above are accurate - nicely organized and laid out! 👍
I have labeled w green UP arrow on the T1 and T3 charts attached.
Don't worry too much about the T3 Hourly Buy Entry point for the green UP arrow. This Buyside Entry is later than your Entry point b/c I use additional time frames to reduce false 1st Entry setups. The downside of my precise approach:
1. Miss out on BUY entries that "takes off" fast.
2. Longer waiting times between Setup "signal" vs Entry "signal".
Ok - let's see how the NZDCAD T1 will unfold.
Btw - didn't even remember where the NZDCAD was located on FXCM MT4! LOL! 😆 Hardly ever trade that pair.
Thx for this setup post! Great work! :clap:
WklyOptions
Attachments
WklyOptions
Well-known member
- Messages
- 269
- Likes
- 24
Hi, KC,
Just a quick follow-up on the NZDCAD trade off the T3 Hourly chart.
The trade hit +1R (50% exited) - then stopped out. Net = even. 😏
Okay, no problem! Next trade please! 👍
Regards,
WklyOptions
Just a quick follow-up on the NZDCAD trade off the T3 Hourly chart.
The trade hit +1R (50% exited) - then stopped out. Net = even. 😏
Okay, no problem! Next trade please! 👍
Regards,
WklyOptions
Attachments
WklyOptions
Well-known member
- Messages
- 269
- Likes
- 24
Did you ever send out the Epdf,s you were talking about on page one???Lots of lines on your trading platform.Regards Mike.
Hi, redtag12,
Yes - pls go to Pg 5 of this thread - and go to Post #30.
The ePDF is attached at the bottom of Post #30 - you can download it directly there.
If you download the ePDF - and read thru the Trend Continuation strategy for the MACD on T1 and T3 time frames - please try to maintain an open mind. The use of multiple time frame criteria and analysis can make the MACD (and many other technical indicators) into a predictive leading indicator. :whistling
We would appreciate it if you also make comments and observations on any and all chart patterns that you find with the proper T1 and T3 criteria/rules.
Thx for your time and input! 👍
WklyOptions
WklyOptions
Well-known member
- Messages
- 269
- Likes
- 24
posting trade results - more meaningful data
Hi, T2W traders,
I wanted to post this issue b/c of the recent increase of posting showing positive results like "my account is up 100% in the past 8 weeks" - or "my account is up 10% in one week", etc. :!:
I am grateful and very happy for these winning results - especially for these fortunate traders! :clap:
However, raw end-point results data are not helpful/meaningful from an educational sharing perspective. It would be more enlightening to have the results presented with additional perspective and data points like:
1. "my account is up 100% in the past 8 weeks" - may be more educational with qualifiers like: "every bet/trade was 2% of the account size", "this result was done over 35 closed trades", "maximum pain/drawdown/adversity was (-15%) during this 8 week period", "maximum of 4 consecutive losses", etc.
Again - the more qualifiers and descriptors - the better it will be for T2W to get a realistic perspective on the betting schedule and volatility/drawdown of the portfolio bankroll. :smart:
So - hopefully we can begin to see more qualified trading results presented from our T2W community of traders! 👍
Regards,
WklyOptions
Similar threads
- Replies
- 5
- Views
- 4K
- Replies
- 51
- Views
- 24K