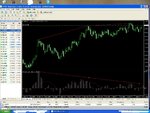
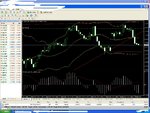
hmm, let's see what we can do with just 2 indicators

TA,
Here's a link to a YouTube video about MACD - one in a series of three - that might be of interest. The presenter isn't great to listen to, but the explanation strikes me as being quite good.
YouTube - Technical Analysis Indicator MACD part one
The great problem with indicators is knowing when the signals they give are wrong. Add MACD to a chart of the FTSE 100 for instance, and you'll see clear negative divergence indicating a short trade. However, the index isn't paying any attention and keeps on rising!
Tim.
 
So why aren't you sticking with it!?
doesn't feel deep enough, i don't know . Doesn't make sense i suppose but i think scalping suits me as im rather impatient and young.
I didn't stick with it also because i got shamed in my other thread for pretending to be a millionaire and decided not to continue.
 
i was just thinking of a really , really simple system composed of 2 indicators.

I'm using bollinger bands and MACD, let's see if this very basic approach can actually make money.

I am not trading pin bars etc any more but i'm saving up so i can afford to learn to tape read and found out i canget all i want from sierra chart from $65/month.

The basic method here is to aim long at lower band when MACD crosses above 0 line, and to go short at the upper band when the MACD crosses below the 0 line.
I have no idea if this works or not so it's a punt i guess. Will be demoing this obviously on the H1+ timeframes.

I use averages and a Bollinger Band. Nothing exceptional about BBs, they tell me when the price is overbought or oversold. When it is one or the other, I still have to go back to the bars to enter a trade. Averages, the same. I use them for trend. These are on the chart and the price is circling around them in cycles. That, I find useful . Those, that are on a separate chart underneath, are almost all based on averages and are lagging, dangerously so, for traders who are looking at them for advice.

MACD, stochastics, CCI, you name it, they have all had their days of popularity and the whole lot of them tell you what to do when it is time to do the opposite. I've never tried that as a signal, perhaps that would work...

Someone is going to mention digression. Like all the others, that works well when it works. When it doesn't, it doesn't, but the followers conveniently ignore the bad signals.

The worst thing about indicators is that one can get bogged down with them, changing from one average to another. What a pain and waste of time.
 
well i'll try a MACD system somebody suggested to me, 'aggressive MACD' settings on 3,11,16 on the forex dailies
 
Decompose the MACD and the Bollies, find out what the price has to do for them to do what they do. It’s really important you understand what the indicators mean (how they are constructed) so you can get back (as others have mentioned) to the price action itself.

Your suggested strategy in post #1 will always have you looking at the bollies hitting one band or the other and then you waiting for the MACD to cross the zero line, by which time...

Bollie band will pretty much always lead the MACD action using the pattern you’re suggesting. If you’re going to continue to play this one (which I don’t recommend), look at what happens when the MACD histo separates from the signal line (there’s a gap between them) shortly after the Bollie band has been out-deviated (LOL) by the price action.

You’ll need to add some form of confirming price action such as waiting for the bar after the price extension through the bollie band (no body contact with the band, just the high/low spike ) to be complete totally within the bands and for it to be a bull bar/bear bar in support of your intended direction – that will be your signal bar.

But, get this out of your system (?) and get back to real basics - just the price. All of what I've just said is visible purely in the price itself.
 
yeh naked trading is good and i have done well (on demo :() with it , very well.

It's just i've never been great with using any indicators. so i tried this, no opportunities yet.
 
yeh naked trading is good and i have done well (on demo :() with it , very well.

It's just i've never been great with using any indicators. so i tried this, no opportunities yet.

Since you are determined, I'll try to be helpful.

About the Bollingers. When you have decided what average to use, it could be helpful to put that average on the chart, too, because if the average is flattish or going down when overbought it might indicate a sell signal. If the average is going up, that could mean that a trend is underway-- not starting--- the trend might have started at any spot between the average and the lower BB line several bars previously. Remember, if the average is too short, you'll be annoyed by swinging, difficult to read, lines.

If the price is trending, it might be helpful to run a trendline up, underneath the bars because a trend break when the price is overbought can, quite often be significant, with a fall down to the average (which is also countertrend, I'm afraid) but it could be a useful point to take profits, at least.
 
Last edited:
well noticed quite a large bearish divergence on the EURUSD dailies.
 

Attachments

  • div1.JPG
    div1.JPG
    194.9 KB · Views: 167
Last edited:
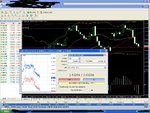
hmm looks like this gap is filling well on the M5, will take profits on the lower band, or the top of the candle on the bottom of the gap

:edit yeh played out nicely, took profits as the gap was filled
 

Attachments

  • gap1.JPG
    gap1.JPG
    205.7 KB · Views: 186
  • gap2.JPG
    gap2.JPG
    241.5 KB · Views: 194
Why have you blanked out lots of stuff on your screen but left your account # up, what's the point? :confused:
 
If you want a system do this.
200EMA, 50EMA...

When 50EMA is above the 200EMA, wait for price to close below the 200EMA and then close above the 200EMA (with the 50EMA still above) @ this point go long... If price then breaks the recent low, you should reverse your position because usually then a big downwards move occurs.
Shorting is opposite.

Check it out on a chart, any time-frame, especially Daily (less time/less work)
 
Trend following systems are great. I use lower averages, but the principle is as old as the hills and works for me.
 
Top