Have you ventured to the dark side yet?

Hi wannagetstacked
Just a 'couple' of questions, but first apologies if they sound too simple, I am relatively new trading: -
With the always-in strategy what is the max spread that you would think the strategy could be effective with. Obviously with a 2-pip spread the strategy is effective but do you think it could be applied to a 3-pip spread which is what the majority of retail shops offer for the EUR/USD?

Same question really applies to the latest strategy posted.

Also with the latest strategy the stop loss and take profit of 11 pips is that figure to include the spread. i.e. for a long position buy at ??84 set stop loss ??70 take profit at ??98 (assuming a 3 pip spread)?

Was the 11 pip found by trial and error and what are the reasons for not using a trailing stop to try to catch major moves?

What are the best market conditions for the strategy i.e. trending or range?

Thanks for your continued postings, which I always find most useful.
 
Lets call the always in strategy A and the new 5 min strat B.
Both of these rely on being able to withstand taking several smaller profits under 10 pips before reaching a desired level of profit. Strategy A takes a few small wins and small losses coupled with some very large profits sometimes of 50+ pips. This is a tough strategy though as you have to be in for every move in order to catch those few large moves that occur, it works in both trending and choppy markets, choppy markets tend to end with a days profits fairly low.
Strategy B however takes out fixed levels of profit on a daily basis.

I would not trade either strategy with anything other than a very low spread of 1.5 - 2 pips maximum. This is due to the fact both rely on taking small profits and break evens occasionally.

The take profit does not include spread as such but it is factored in. For me net profit works out at 9.5 pips per trade.

An example may help. Breakout long of 5 min bar which starts at price xx74 to xx79. Entry at xx81, stop at xx72. Take profit at xx 92. Max initial loss is 9 pips(exc spread) Profit is 11 pips.
This example uses a 5 min bar which is only 5 pips in length. After spread of 1.5 net profit is 9.5pips and max net loss is 10.5.
It is quite rare however to be stopped out for the full initial loss, this is due to trailing a stop behind each bar reducing risk as you go, scalpers help provide the initial momentum in order to move the stop up under the next bar.
On the above example if I had a 3 pip spread then net profit would be 8 pips, net max loss 12 pips. There is therefore a huge difference when spreads are larger.
The target of 11 pips is specific to the eur/usd pair during peak trading hours, this particular value was picked as it is large enough to allow failed trades to often end with a small profit, but also large enough to negate the effects of spreads and provide a decent net profit when it is hit.
Trailing stops would work well in trending markets to achieve larger profits, the problem however is that during strong trending markets the 5 min bars will be larger than 5-7 pips long, therefore risk increases and your take profit level would comparitively need to increase to provide a 1:1 R:R.

The best market conditions are those away from announcements, before announcements the market tightens up too much, following the announcement the 5 min bars increase in length( the problems with this discussed above). You can however trade an hour or so after the announcement when volatility decreases.
If you notice prices are in a tight range under 20 pips then avoid trading. A general indicator that prices are going to start ranging is when they fail to breach the previous swing high or low, indecision then occurs, and prices subsequently find nowhere to go.

I think that covers your questions but let me know if there are any others.

Nathan
 
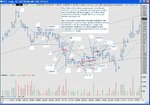
Todays action using the 5 min breakout strategy outlined yesterday.

Nathan
 

Attachments

  • 22.03.05.JPG
    22.03.05.JPG
    123.1 KB · Views: 299
Another excellent post Nathan,
Your entries follow your description of when to bite. Tell me about the area between the little boxes that say 71 and 67. Was there something that kept you from going short there?

JO
 
Yes there was, that small downtrend presented two lower lows signalling a change in direction, my entry was therefore 2 pips below on the next bar short, the next bar only managed to fall 1 pip lower. I require the 2 pip filter to be hit on the next bar after i decide i will enter. This helps to show the benefit of a 2 pip filter over a 1 pip filter as that particular trade would only have broke even after spread costs. Ideally I would use a 3 pip filter, but this would reduce profit margins too much.
With every breakout strategy on anything short term I would only use a 2 pip filter, 1 pip filters fake out far too often and are not worth the hassle. If my 2 pip filter is hit then the move will generally have some momentum and enable me to move my stop and reduce risk on the next bar.

Nathan

Nathan
 
I may have posted something similar to this before. It is just a simple way of determining whether you should be in the market on any particular day using basic price analysis. Today is a good example of a day where it may be worth not trading.

As always using Eur/usd.

Nathan
 

Attachments

  • 30minView.JPG
    30minView.JPG
    115.5 KB · Views: 450
This chart is an update on the last chart I posted yesterday which was a 30 minute chart. I outlined 2 areas where pressure should develop and commented that the day would be quite flat as it was inbetween two swing points. Well the day was flat but there were a couple of trades from the 30 minute charts later in the day.
This new chart shows how I play these points, they are very simple mechanical trades using fixed stop and take profit points of 10 pips.
The reason they have a high probability of success is because there are so many limit orders gathered at these points.
I too use limit orders to enter these trades.
You will notice that a lot of the moves offer many more than ten pips, so this could be altered to suit the individual trader. I however find 10 pips rarely fails and can give nice profits as I view these types of moves as "safe" if there is such a thing, I therefore make use of leverage on these particular moves.

Any Q's just ask.

Nathan
 

Attachments

  • 30MinUpdate.JPG
    30MinUpdate.JPG
    128.8 KB · Views: 444
wannagetstacked said:
The reason they have a high probability of success is because there are so many limit orders gathered at these points.
.

Any Q's just ask.

Nathan

Sorry again for my lack of understanding Nathan but could you explain a little bit more about the above statement?

Why are there so many limit orders gathered at these points? (is it because so many traders use the 123 set-up to trade?) and how does it benefit the strategy.
 
Happy to help
Its not that people use particularly the 123 setup. These points of entry displayed are swing points and simply are logical places to put a stoploss. So when these points are breached people all leave the market at the same time, or reverse their positions, causing an initial boost in prices. These factors make trades taken here higher in probability.
 
Fantastic thread - An abundance of charts/explanations useful to any trader of any instrument and a thread devoid of the juvenile bickering found elsewhere. Perhaps this thread should be added to "Resources."
 
Should be starting this thread again with a couple more tid bits for anyone that is interested. It will focus on the euro, so i trust it will be relocated if neccessary.

Nathan
 
My trades are mainly price and volume pattern based.

Call me old fashioned but I am very fond of the 50 and 200 simple moving average's.

close below/above these averages can provide a simple effective stop loss.
 
Hi,

Great thread Nathan. Just started reading this a few days ago.

Is it just me or are other people also missing most of the thumbnail graphics?
 
Agreed and "Hi Firehorse!" by the way - long time no see. :) It seems only yesterday you were helping me with disciplinary matters on the Basement Thread. ;) How's it going?
Thumbnails are fine my end FWIW.
 
Forex 5 minute chart

Support/resistance on a 5 minute chart and a nice short. But are traders prepared to wait around for "set ups" ?
Enjoy your week end ;)
 

Attachments

  • FC.JPG
    FC.JPG
    140.1 KB · Views: 377
This is yesterdays 1 min chart of the eur/usd.(Post announcement)
Following an always in stop reverse strategy.
This a day late but follows the same principles as usual.
Feel free to post your own analysis, preferably not based on indicators, ideally on the eur/usd or Dow.

Nathan
 

Attachments

  • 10.06.05.JPG
    10.06.05.JPG
    142.3 KB · Views: 353
Wanna...........

wannagetstacked said:
This is yesterdays 1 min chart of the eur/usd.(Post announcement)
Following an always in stop reverse strategy.
This a day late but follows the same principles as usual.
Feel free to post your own analysis, preferably not based on indicators, ideally on the eur/usd or Dow.

Nathan
Oops sorry if I transgressed :eek:
 
No worries neil. I don't mind what is posted. Just thought i'd give guidelines as i can't really comment about indicators or other instruments as i don't follow them.

Cheers for posting.

Nathan
 
neil said:
Support/resistance on a 5 minute chart and a nice short. But are traders prepared to wait around for "set ups" ?
Enjoy your week end ;)
What else is a 5 minute trader to do? (Not be facetious here, seriously - what is the alternative?)
JO
 
Top