Have you ventured to the dark side yet?

No worries m8. Something always gets in the way doesn't it?

Always like when (unlike yourself) the short trades develop into longer trades. Although this doesn't happen as often as I would like.

I would like to say thanks for starting the thread, reminded me of what I used to miss over on the futures.
 
GammaJammer said:
JO - I've just read your post and it puzzled me a bit. Surely if you're long in one account and short in another the positions net off and all you're doing is tying up trading capital.

Are you really saying that you want to find a way of splitting up the short term and long term P+L for analysis purposes? as this seems to me to be the only benefit you'd gain from what you are describing.

I often trade a shorter time frame while I'm in a longer position. Usually it's an attempt to improve the average rate at which I'm in my longer term position. Ideally every trade ends up with the same stop loss you put on when you opened the trade, but with a guaranteed profit even at that level. Then you can have a bit more leeway in leaving the position on. This is often known, at least in FX, as jobbing (a term which I think may mean something else in equities - FB?).

I may for example buy a breakout, cut half position at some predetermined point (often equivalent to some multiple of distance from entry to stop level) but then may lookm to re-establish full sized long on a retracement. Do that a couple of times and you've locked in a guaranteed profit even at your original stop level (I know this isn't rocket science). If however I was really sure the market had hit a temporary brick wall I could of course sell the whole position, and re-establich at a lower level. But in such a circumstance I wouldn't be overly concerned about HOW to reflect the P+L. All ends up in the same pot at the end of the day. Sometimes that pot belongs to me, sometimes to the bookies.

GJ

Some platforms (www.cms-forex.com for instance) allow you to hedge an open position with a trade in the opposite direction. Here why a trader might want to do it:

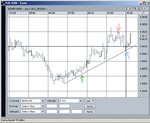
In the chart below, I was long at the green arrow. Although I wanted to stay in my long position, I saw a setup for a retracement at the orange arrow which might be as large as 30% of the current profit in the position. There are at least three or 4 options here.

Gut out the retracement, and wait to see if the uptrend continues.
Exit the position and wait to enter long again at when you see the setup you want.
Exit the long position and go short.
Hedge the long position with a short entry at the orange arrow
(close the hedge at or slightly after the blue arrow, and continue with your long pos...)

Call me greedy., but I when I work the math, the 4th option makes a fatter bank account (assuming you can pick the entries). Now that's a big assumption for me, but I know that experienced traders do it.

The beauty of the hedge, is that if the price crashes through support, you close the long instead, and your short entry has a perfect reason for a tight stop.

I'd also like to be able to hedge if I'm in a position with significant profit, and I expect the trend to continue, but I need to go eat lunch or run an errand. I'll probably lose some profit while I'm away, but I can leave without fretting, and when I get back, if I like what I see, I 'm still in the original position, - and I don't have to wait (possibly hours) for a good re-entry setup.

Your mileage may vary...
JO
 

Attachments

  • WhyHedge.gif
    WhyHedge.gif
    28.3 KB · Views: 254
A quick chart of todays eur/usd action from a price action perspective.
Using a zoomed out 1 minute chart, a 4 period bollinger band has been placed on to emphasise stop placement by cutting out a little noise, the bollinger bands are not vital however.
Basically this is a stop reverse strategy, as you exit the position when buying pressures turn to selling pressures and vice versa.
This is a little different to the sub minute posts previously as it takes a wider view of buying and selling pressures.

Note, i was not trading today with money as i couldn't be at the screen all day, a couple of the trades are drawn on after the fact, these entries and exits would have been the same anyway.

It is vital to technically trail stops with this strat. The strategy also requires you to be in the market all the day,

Take a look

Nathan
 

Attachments

  • 240105eurusd.JPG
    240105eurusd.JPG
    118.1 KB · Views: 270
Thought I would update on the previous post,

This update is some after hours trading, continuing the stop reverse strategy, with trailing technical stops. This strategy can be traded successfully after hours.

2 further trades came to break even, next trade long at 8.10 pm gave 12 pips before reversing, the following short at 10.10pm is currently 22 pips in profit, stop at 1.3040, I expect this to be hit soon,

Nathan
 

Attachments

  • 240105eurusdUpdate.JPG
    240105eurusdUpdate.JPG
    96 KB · Views: 268
Using the exact same method as explained last nite, Stop reversal strategy with trailing technical stop loss, this is the graph showing where the last trade closed and the following 7 overnight trades,

Any questions about entries or exits just ask,

Nathan
 

Attachments

  • 240105eurusdUpdateNew.JPG
    240105eurusdUpdateNew.JPG
    118.4 KB · Views: 272
Very good overnight trading for this strategy,
The last trade I posted last night was at taken short around 8pm, stop loss was at 1.3040, this was not hit and stop loss trailed down to 1.3025 where the trade reversed long.
Following this there were 7 further trades, 6 winners and 2 losers. Using the same methods for reversal entry and exit throughout.
 
wannagetstacked

Your charts are they 1 min. I can see that you look to enter once previous resistance is taken out following a new direction. In the past I have waited for a new direction to break an intraday trend/direction but then entered on the next support for the new move which can be earlier than waiting to take out the resistance level or point 2 for Hook enthusiasts. As I am sure you are aware a trend change is not complete until point 2 has been taken out so your system is following good practise.

However I use it on a different instrument and from a 5 min time frame. If your charts are 1min then using resistance as you do is a very good filter IMHO. The faster chart throws more at you and I have found it unreliable to trade throughout the day using this method. Although it is very good for the 1st hour to 90 mins of the UK session and then the US open when volatility is high.

At least your set up is simple which is always a good thing in your trading. What I would be interested in is how do you define your stop. Is it a predetermined risk level or according to the price action that has already taken place.

Regards

Kevin
 
Having read my post again I feel I should clarify; in respect of a method being unreliable I was referring to my own set up used on a 1 min chart on the FTSE as a method of trading throughout the day and not in any way applicable to the FX or the system employed by Wannagetstacked.

That should sort it out, phew!

Regards

Kevin
 
Kevin,

The charts are 1 minute, however the 5 minute chart gives very similar entries and exits. I have found however my personal preference is to use the 1 minute charts, I always have them zoomed out however to contain at least 24 hours worth of information.
Stop points are determined purely by price action, another reason I use the 1 minute charts is because the maximum stop loss I would initially incur is never usually larger than 15 pips.
The tightly placed bollinger plans help to add a few more pips onto my stop reversal points,usually my stop is placed 3-5 pips above/below the last swing high/low in any trend, this type of trailing stop and reversal can really clock up the pips.

I hope this answers your question bud,

I have not tested this on any other currency pairs as eur/usd is where my focus lies.

The setup is very simple, but requires constant monitoring,

Here is an update from the last posted trade, still short, none of the stops have been taken out and I have no reason to reverse yet. currently 45 pips in profit so i'd expect a reversal soon enough, might not happen though so don't be putting your money long just yet.

Nathan
 

Attachments

  • 240105eurusdUpdateNew2.JPG
    240105eurusdUpdateNew2.JPG
    106.4 KB · Views: 238
Stop reverse point now at 1.3028, if this is hit then I would then go long, at this moment in time that would mean my initial stop loss point would be at 1.3015(under the lowest point of the last swing low,

Nathan
 
Limit order was filled long at 1.3028, stop 1.3015,
Stop will be trailed a few pips under the next swing low
 
Stop reverse hit at 1.3020 a while ago, 8 pip loss.
Currently short, Stop up at 1.3034, looking to place new stop above next swinghigh in this developing downtrend, very strong support however at 1.3018 area which I will keep an eye on.
If this short is stopped out for more than a 10 pip loss I will quit trading for a while and maybe resume later in the day.
This is in my trading plan, I have had good trades so far and do not want to continue trading in a bad mood,

Nathan
 
Out for a 14 pip loss, going long now would mean an initial risk of 20 pips, So now seems an appropriate time to take a break as I don't feel prepared to lose 20 pips at this moment. This is one of the discretionary parts of my trading plan and is mainly for my psychological wellbeing, a happy trader is a successfull trader.

Nathan
 
Nathan

Thank you for the reply. Out of interest when you finish trading could you let us know how long you traded and how many deals your system created during this time.

Good luck

Kevin
 
I'd prefer not to go into detail about my personal trades, as a few of the trades I posted were missed by me, I thought however that it was worth putting these on as they are trades I would definately have been in, and having them on helps create a fuller picture of the last 20 or so hours of trading.

I tend to never be away from my computer for more than a few hours, and sleep whenever i'm tired. Not the most social life.

I hope this helping a few people out,

Heres a chart showing my last couple of losses

Nathan
 

Attachments

  • 240105eurusdUpdateLast.JPG
    240105eurusdUpdateLast.JPG
    123 KB · Views: 250
Please note that the past 24 hours trading have been better than average for this system due to prolonged up and down moves throughout, a horizontal day can pose more problems, as long as there are a few prolonged moves of 20+ pips it should still perform well enough to cover losses.
The benefit comes when you have 50+ pip moves as usually it will catch them all.

Nathan
 
This is a chart showing the trading conditions after my last position was stopped out, reversing on this position would have meant a 20+ pip risk.
The chart shows how these are risky conditions to trade in. This is also another trade filter and is probably one of my biggest loss savers as it keeps me out of stupid high risk trades.

Nathan
 

Attachments

  • RiskyTrades.JPG
    RiskyTrades.JPG
    110.6 KB · Views: 225
Thanks for another series of really useful posts. I've often wondered about the possibility of being 'in' all the time (you leave a long open until you are ready to go short, etc..). If I understand you correctly. There are at least two times when this does not work:

The market starts to base - it goes sideways in a range that is to narrow to trade.
and
Volatility picks up, with long moves between swing points, but the trend is not clear to you- and hence the stop under the last swing point makes the trade risk higher than the likely benefit.

JO
 
Top