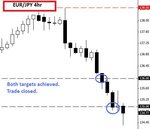
Hi FX jake,
I've been following your thread for a while now and appreciate the time and effort you give sharing your trades.
Thanks!
I'm new to technical FX trading and have never copied your trades until this one as it matched my setup exactly.
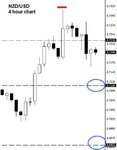
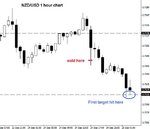
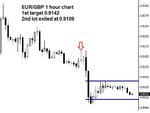
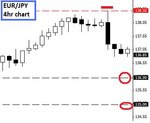
I drew my s/r levels by eye and looked for price action above the support line and then used the daily pin bar as added rationale to play long..
That looks like a nice bullish bar to me.
do you do the same thing?
i read earlier in the thread that you find levels 'as you see them' and then play candle/price action around them..
however i have been trying to reverse engineer your trades and previously thought it may have something to do with calculated pivots and the swings through them?
I don't use pivots, but I am aware of very successful traders who do. I sometimes will put other stuff on my chart when it gets a bit boring looking at price, fib retracements, moving averages, MACDs, all that stuff. But really it is simply decoration. I like to see the market hit a nice support/resistance zone and then print a bullish or bearish candle. If the market hits support or resistance and doesn't really show it's hand, I wait for the next trade.
thanks for all your advice so far..:smart:
joy

