You are using an out of date browser. It may not display this or other websites correctly.
You should upgrade or use an alternative browser.
You should upgrade or use an alternative browser.
FX_Cowboy
Well-known member
- Messages
- 250
- Likes
- 16
For this round, I'm using static charts, which is the reason I'm not going to a shorter bar interval to fine tune the entries (which I think could be improved somewhat). My immediate goal is just to get an idea of what the success/failure ratio would be using the most simple, objective entry criteria I could think of. The advantage of this is that I can go through static charts relatively quickly, using entry criteria that would be (or at least should be) no different than if I were replaying the price data.dbphoenix said:D,
Are you backtesting using static charts or replay?
I believe that the results I'm getting could be improved substantially by putting these trades into the context of what price is doing in an hourly (or even daily) timeframe, but before starting on adding filters or other variations on this theme, I though it might be useful first to obtain some baseline results against which I can compare future refinements.
FX_Cowboy
Well-known member
- Messages
- 250
- Likes
- 16
In the context of the entries I'm making, I guess that would translate to finding some higher level of support by looking at a 1-minute chart (or perhaps a tick chart) in order to find some higher support level, which would make sense. Thanks for the input Jon.barjon said:An obvious example would be where the price made an early dash to make the low of the day, then moved up from there and consistently found support at a higher level during the day. I'd set my stop just below that level and not the low of the day.
Hope that's clear without a picture 🙂
🙂
dbphoenix
Guest Author
- Messages
- 6,954
- Likes
- 1,266
FX_Cowboy said:For this round, I'm using static charts, which is the reason I'm not going to a shorter bar interval to fine tune the entries (which I think could be improved somewhat). My immediate goal is just to get an idea of what the success/failure ratio would be using the most simple, objective entry criteria I could think of. The advantage of this is that I can go through static charts relatively quickly, using entry criteria that would be (or at least should be) no different than if I were replaying the price data.
Then I suggest that you set aside the "breakout through S/R" condition for the time being as this need not have anything to do with the PDC and the PDH.
By the same token, don't reject a general failure of the tactics using the PDC and PDH -- if there is a failure -- as applying to BOs through S/R in general. Instead, consider that you have not yet found the most productive S/R.
FX_Cowboy
Well-known member
- Messages
- 250
- Likes
- 16
Good point. In fact, I think you've saved me from wasting some time. This exercise has made it abundantly clear to me that the PDH/PDL do not constitute S/R in and of themselves, although of course S/R are sometimes found at those levels. I think I have enough samples to safely say that, even with good entry tactics, the results of making entries without really taking support and resistance into considertaion will be mixed. Looking at the charts I've posted, I think there was a ratio of about 2:1 successes to failures for the entries themselves, but it would be dangerous to generalize those results without taking taking the context of those trades further into consideration.dbphoenix said:Then I suggest that you set aside the "breakout through S/R" condition for the time being as this need not have anything to do with the PDC and the PDH.
Absolutely. I think the tactics are good, but I recognize I'm not applying them in the right places. So rather than spending time recording the results of making good entries without regard to S/R, I'll instead focus on finding S/R and then see what the results will be when making good entries at appropriate places.By the same token, don't reject a general failure of the tactics using the PDC and PDH -- if there is a failure -- as applying to BOs through S/R in general. Instead, consider that you have not yet found the most productive S/R.
Thanks for the nudge in the right direction.
FX_Cowboy
Well-known member
- Messages
- 250
- Likes
- 16
Alright, I'm going to try a new tack. Instead of insisting that S/R exist where I think they should ( 😱 ), let me instead approach this the way I would actually approach finding S/R, which is to examine where important support and resistance levels have existed in the past.
I'm going to go over approximately the same time period as before, but I'll start by looking at weekly, daily, 3-hour, and hourly charts to identify those levels that have displayed the characterics I'm looking for -- namely, key levels which have been important enough to turn price in the past.
Attached is a weekly chart, which I've marked up to show some of the more important S/R levels, especially those near the price level we saw in early March (which is where I'll start to look at actual entries).
Just a couple of quick notes on the chart: the green diagonal trendline, which began around February 2002, was broken in May, 2005. From that point, price fell until it found support in November and December 2005 at around the same level where price had been turned back upward in April and May of 2004. In January, 2006, the downward sloping red Supply Line (marked SL) had been broken, and by early March, price had fallen to another important support zone (around 1.1850), and was turning back up again.
So, by March, 2006, the upward TL had been broken, and price had retraced to a former important support zone. At this point, we didn't know whether we were witnessing a reversal, a retracement in the main trend before it started upward again, or the beginning of a consolidation range.
Attachments
Last edited:
dbphoenix
Guest Author
- Messages
- 6,954
- Likes
- 1,266
Which brings us back to using static charts vs replay (referring to post #25).
As you know, S/R is not necessarily a point or even a level but a zone of activity. You can often -- or usually -- determine whether or not you've found S or R by how price behaves when it approaches that zone and/or when it gets there. If its behavior doesn't change, then you probably aren't looking at any particular S or R. And if you aren't looking at any particular S or R, then there's nothing to break out of.
Therefore, I suggest that you consider doing your testing using replay. This will enable you to see how the behavior of price changes -- if it does -- as it approaches and reaches whatever level of S or R you think may lie ahead.
If you don't understand what I'm talking about, sing out.
FX_Cowboy
Well-known member
- Messages
- 250
- Likes
- 16
dbphoenix said:Which brings us back to using static charts vs replay (referring to post #25).
As you know, S/R is not necessarily a point or even a level but a zone of activity. You can often -- or usually -- determine whether or not you've found S or R by how price behaves when it approaches that zone and/or when it gets there. If its behavior doesn't change, then you probably aren't looking at any particular S or R. And if you aren't looking at any particular S or R, then there's nothing to break out of.
Therefore, I suggest that you consider doing your testing using replay. This will enable you to see how the behavior of price changes -- if it does -- as it approaches and reaches whatever level of S or R you think may lie ahead.
If you don't understand what I'm talking about, sing out.
Okay, that sounds good to me. And in the message I just posted (seemingly seconds before you did), I'm making a start on identifying the S/R levels I think will lie ahead. Once I'm done with that, which will be tonight sometime, I'll then use replay to go through the days individually and observe the behavior of price.
EDIT: And although it is not the only clue, THIS is one place where, Zuke (if you're still following this thread), volume can play an important role. My observation in the past has been that volume usually spikes up as price passes through an important S/R level. I'll be keeping my eyes open for what happens to price as well.
Last edited:
dbphoenix
Guest Author
- Messages
- 6,954
- Likes
- 1,266
FX_Cowboy said:Okay, that sounds good to me. And in the message I just posted (seemingly seconds before you did), I'm making a start on identifying the S/R levels I think will lie ahead. Once I'm done with that, which will be tonight sometime, I'll then use replay to go through the days individually and observe the behavior of price.
EDIT: And although it is not the only clue, THIS is one place where, Zuke (if you're still following this thread), volume can play an important role. My observation in the past has been that volume usually spikes up as price passes through an important S/R level. I'll be keeping my eyes open for what happens to price as well.
When you do, replay these three bars. They may be of special interest.
Attachments
dbphoenix said:When you do, replay these three bars. They may be of special interest.
FX and everyone else, Please excuse the interuption ....
DB - I noticed that your chart was created by using Ensign Window. Is that what you use for replays?
Also, how would i be able to join the "price and volume" group? I would very much like to enter the Mapping the Territory section
thank you
dbphoenix
Guest Author
- Messages
- 6,954
- Likes
- 1,266
v.. said:FX and everyone else, Please excuse the interuption ....
DB - I noticed that your chart was created by using Ensign Window. Is that what you use for replays?
Also, how would i be able to join the "price and volume" group? I would very much like to enter the Mapping the Territory section
thank you
I only copied D's chart into Paint Shop Pro and drew my box on it. I use Sierra Charts, which provide the replay function. I understand, though, that Ensign also offers replay.
As for the PV group, it's defunct. However, there is a public PV forum with a number of interesting threads.
FX_Cowboy
Well-known member
- Messages
- 250
- Likes
- 16
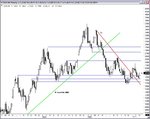
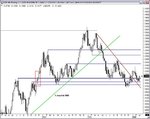
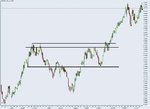
Here I'm adding daily, 3-hour, and hourly charts, at each level adding slightly more detail and attempting to identify the important S/R levels. I've tried to err on the side of fewer rather than more lines on the chart. These three charts are all based on the June contract date, and price data prior to March starts getting sparse, especially on the daily chart. Nevertheless, I think the main outlines are clear enough to work with.
So, the plan now is to go to chart replay, and to observe what happens as price approaches these levels, and other important S/R levels I may think are developing as I go along.
So, the plan now is to go to chart replay, and to observe what happens as price approaches these levels, and other important S/R levels I may think are developing as I go along.
Attachments
FX_Cowboy
Well-known member
- Messages
- 250
- Likes
- 16
Unfortunately, the only archive of Ensign playback files I know of only goes back to 2004 for Euro futures. I was able to find a daily chart of the period, however, which I've attached here. Does this capture what you found interesting?dbphoenix said:When you do, replay these three bars. They may be of special interest.
Attachments
dbphoenix
Guest Author
- Messages
- 6,954
- Likes
- 1,266
FX_Cowboy said:Unfortunately, the only archive of Ensign playback files I know of only goes back to 2004 for Euro futures. I was able to find a daily chart of the period, however, which I've attached here. Does this capture what you found interesting?
Yes and no. There's no substitute for watching the bar form, but you can get some sense of how price is behaving in relation to these S/R levels from the length of the bar and to the relationship of each open and close.
What do these bars tell you about the role of momentum in the success of either a BO or a Ret?
FX_Cowboy
Well-known member
- Messages
- 250
- Likes
- 16
dbphoenix said:Yes and no. There's no substitute for watching the bar form, but you can get some sense of how price is behaving in relation to these S/R levels from the length of the bar and to the relationship of each open and close.
What do these bars tell you about the role of momentum in the success of either a BO or a Ret?
What I find interesting is how traders might easily have been wrong-footed in the bars (days) leading up to the breakout. That second double top (in October), followed by price passing below the "V" of the formation might have attracted quite a few traders to short positions -- especially as this formation occurred slightly lower than the first double top (in May/June). When price found support just below that formation and then moved back up, I would expect that short covering would have created quite some momentum upwards.
Price then moved back to approximately the level of the double top (resistance), and there is a red bozo from that point, indicating that many traders used that level to get short (and price closes near the bottom of the bar). Then comes the dramatic breakout, with a green bozo more than twice the size of the previous bar, but this time the bar close is near the top. Again, I would think that short covering (due to this dramatic about-face in direction) would have added greatly to the upward momentum here.
Again, price moves to a resistance level (the approximate level of the first double top), and sellers seem again to want to get short at this level, and in fact drive price down below the level of the first double top (with the final bar in this move another red bozo). Then a doji forms. And then, again, price reverses dramatically with a green bozo that rises to the top resistance level. There is an inside bar at this point -- a day of hesitation -- before price breaks out through this level as well. Price retraces to the top S/R level, now acting as support, before continuing upward.
So what I'm seeing here, is that a sudden directional change -- when some traders are surprised and have to exit their trades quickly, or even take the other side -- creates a momentum that greatly increases the chances for a successful BO and RET.
Fascinating. I'll keep my eyes open for similar situations as I replay these charts.
FX_Cowboy
Well-known member
- Messages
- 250
- Likes
- 16
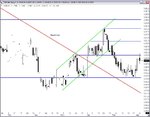
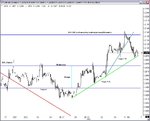
The first day I'll playback "blind" is 3/7, but that day's file starts right after a BO, so I played back the previous day as well (knowing full well how it would end up). I've attached the chart of 3/6 with some notations, but I wanted to add a couple of additional comments. There are at least three levels on the chart where buyers might have gone long, only to become disappointed, or levels just below which stops may have been hit. The first is the level of support from the previous week (the gray line); the second is the area of the 3/3 low, which also corresponds to the Stage 1 TL on the hourly chart; and the third is just after price failed to continue downward after breaking through the previous low at around 1.2065.
All of this just adds to the momentum to the down side, giving further justification for selling the retracement after the BO, which is the point where 3/7 opens.
All of this just adds to the momentum to the down side, giving further justification for selling the retracement after the BO, which is the point where 3/7 opens.
Attachments
FX_Cowboy
Well-known member
- Messages
- 250
- Likes
- 16
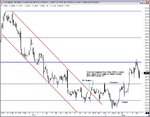
In the attached chart, I've drawn in the S/R level from the hourly chart I prepared in advance. Price has broken out through that level as 3/7 begins, and price has retraced to that approximate level.
The first entry fails (chart 1).
Then price proceeds above the S/R line I had drawn in, seems to find some support there, and heads up another 8 or 9 pips, before again dropping to that same S/R level (which I adjusted downward slightly to better reflect where I saw S/R). Then price drops straight down over the next four bars to form a double bottom.
At this point, I'm thinking that I may have missed the retracement completely. The level I drew in the S/R is a zone, not a finite line (so I may have set it too low). Perhaps I should have also gone short when price hooked down the second time, but price had just made a higher high (HH), the S/R level I had drawn in had been broken,and a DL drawn from the low point of the breakout had not been broken. So a short at that point looked risky. In hindsight, I see an entry, just above the S/R line, which would have been a good entry, but I dismissed it in real time, because it was above the S/R line.
At this point (chart 2), price has made a double bottom, has retraced again to 1.2034, and looks like it may continue in the direction of the BO. This follows my rule (below S/R line, second entries are okay), so I decide to enter short again at 1.2030 if price hooks here again.
This entry succeeds, and price proceeds to continue downward for a MFE of 87 pips (chart 3), and settles (mostly) into a range by the end of the day. The bottom of the range is roughly the lower S/R level drawn in on the hourly chart.
Attachments
Last edited:
using volume as BO Indicator
Hi, my interest is the spot fx market. how can i get access to the volume information from Globex please?,
Hi, my interest is the spot fx market. how can i get access to the volume information from Globex please?,
FX_Cowboy said:I'm beginning this journal in an attempt to improve my trading. I'll be documenting my efforts to develop an "edge" -- a single, consistently profitable setup -- and to establish a trading plan based on that setup.
This journal is actually the continuation of a journal I started almost a year and a half ago, in DBPhoenix's "Mapping the Territory" member board. I haven't posted much to that journal over the last six months, so this journal is also an opportunity for me to start afresh, and to complete a task (which I regard as just a single step in a larger journey) that I have left unfinished.
As before, the objective is a written trading plan based on a breakout (BO) and retracement (RET) strategy. I believe that developing this plan will help me to overcome one of my main problems as a trader -- taking impulsive trades -- while making my trading more consistently profitable by providing researched, probability-based justifications for my trading decisions and minimizing the impact of emotions on my trading behavior.
I trade by price (and watch volume as a sort of punctuation for what I'm reading from price), but use no other indicators. The market I trade is the Euro/USD spot market. I get my volume information from the GLOBEX Euro futures market, which I monitor concurrently.
DBPhoenix has been kind enough to provide commentary from time to time in my previous journal, and I certainly hope he will continue to do so in this journal. Comments from others -- especially trader interested in and/or experienced with breakout and retracement setups, and those knowledgeable about trading forex -- are also most welcome.
FX_Cowboy
Well-known member
- Messages
- 250
- Likes
- 16
There are a number of data providers that cover Globex instruments, some of which are bundled with financial charting software. I use Interactive Brokers as a data provider (and I believe they are one of the least expensive), but there are many others offering this data.fbazuaye said:Hi, my interest is the spot fx market. how can i get access to the volume information from Globex please?,
EDIT: Just to be clear on this, Interactive Brokers is a brokerage, but their datafeed is used by several charting packages, including the one I use.
dbphoenix
Guest Author
- Messages
- 6,954
- Likes
- 1,266
FX_Cowboy said:At this point, I'm thinking that I may have missed the retracement completely. The level I drew in the S/R is a zone, not a finite line (so I may have set it too low). Perhaps I should have also gone short when price hooked down the second time, but price had just made a higher high (HH), the S/R level I had drawn in had been broken,and a DL drawn from the low point of the breakout had not been broken. So a short at that point looked risky. In hindsight, I see an entry, just above the S/R line, which would have been a good entry, but I dismissed it in real time, because it was above the S/R line.
When trading S/R in real time, you will have to make adjustments between what you thought S/R was and what it turns out to be. There's nothing wrong with waiting for confirmation since a genuine move in the desired direction will put you in the black almost regardless of where you enter. However, entering at the optimal time can usually provide you with a tight stop, and you're already in when others jump in alongside you.
One clue to these less-than-obvious levels is to look at the first place price chokes on the way back (the red circle). R here may be trivial or it may be important. But if price drops back through this level, the penetration may prompt short-selling or at least long exits. Whether all of this is worth it to you depends entirely on your risk tolerance, aggressiveness, and discipline. Noting the level of "activity" at this level may help you decide what to do.

